Categories
Excel Training Power BI Professional & Management

30 Reasons You Should Be Considering Power BI – Part 1

A lot of people out there think that the story of Power BI is too good to be true.
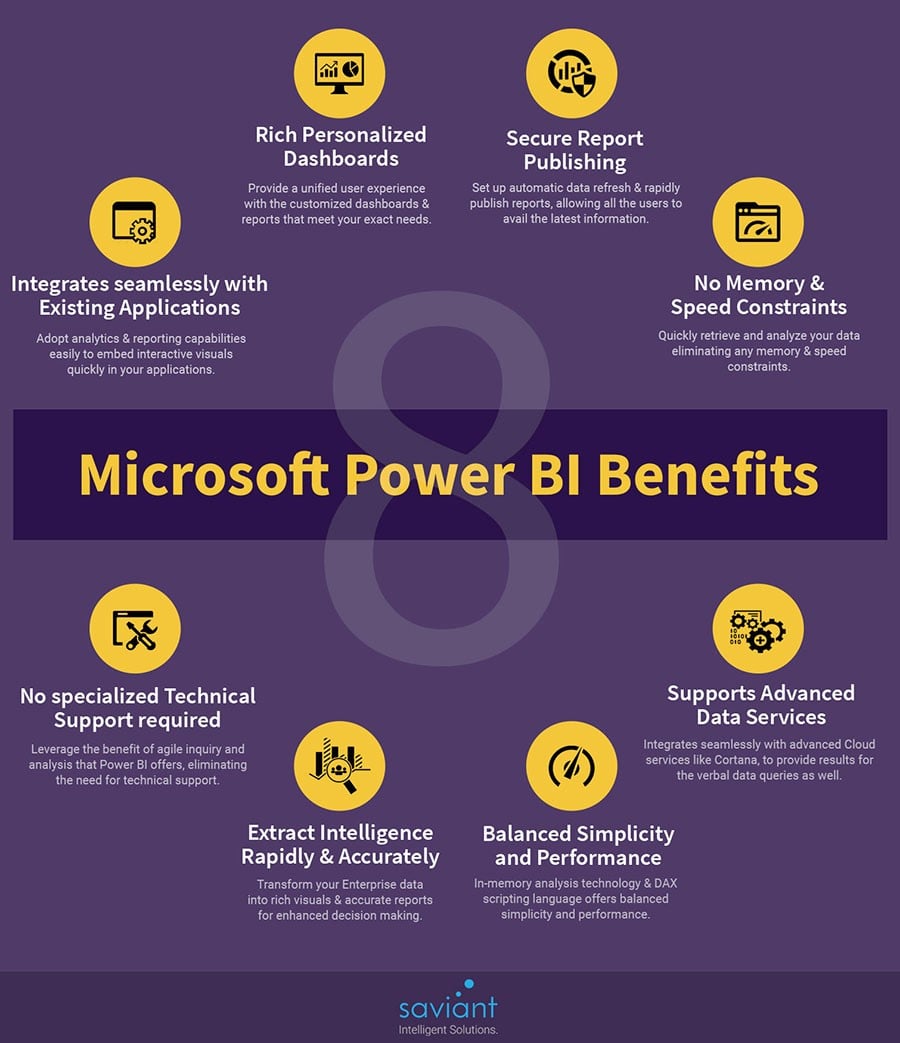
Here is a list of the reasons that we think you should consider Power BI as a self-service and/or Enterprise Business Intelligence Solution.
It’s like the new Microsoft

Microsoft have not been the best at listening to traditional customer concerns, however they have consistently delivered world-class business software for many years. Under Satya Nadella’s leadership and James Phillips (head of business applications), Microsoft are changing the landscape of BI software and they look set to dominate this space for the next decade.

Power BI is built from the ground up on SAAS heritage

Built by the crack team who developed the SAAS for Power BI from scratch.

Power BI is built from the ground up on SSIS heritage

Another part of the puzzle that Microsoft have mastered on their first attempt and Microsoft have already proven that it is winning in this space.

Power BI can virtually ingest data from any source

Power BI can easily connect to any on-premise data or cloud data sources such as Google Analytics or Salesforce.com

Power BI is highly compressed

The data in Power BI is 600% more compressed meaning a 1GB database compress down to 85MB

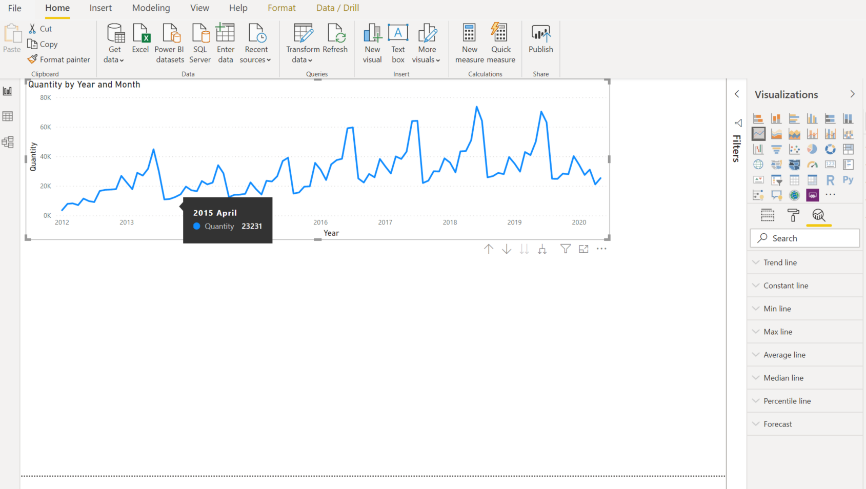
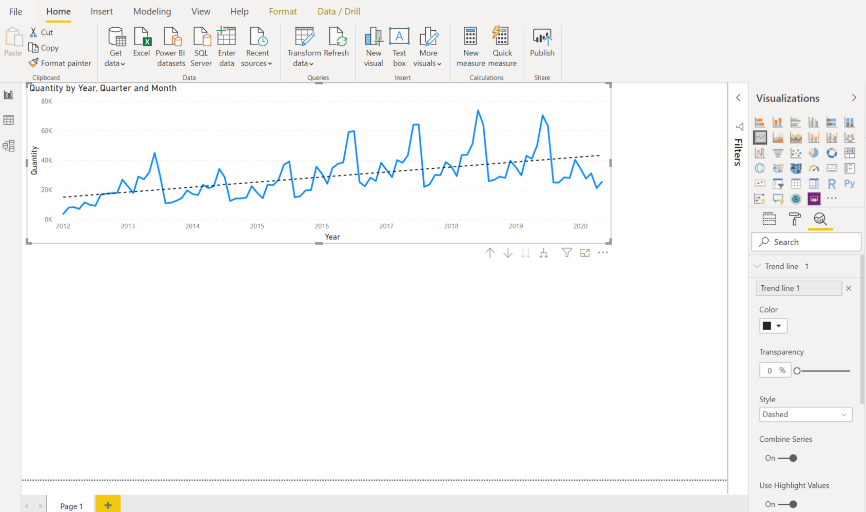
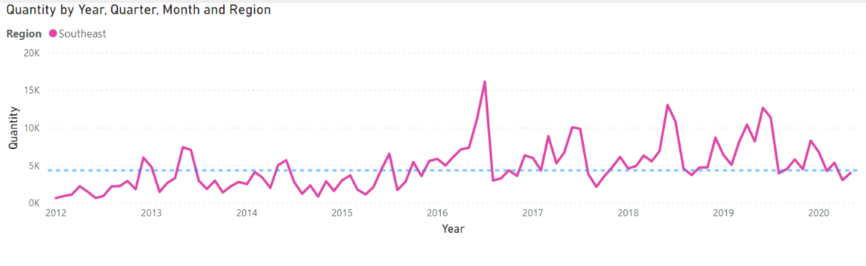
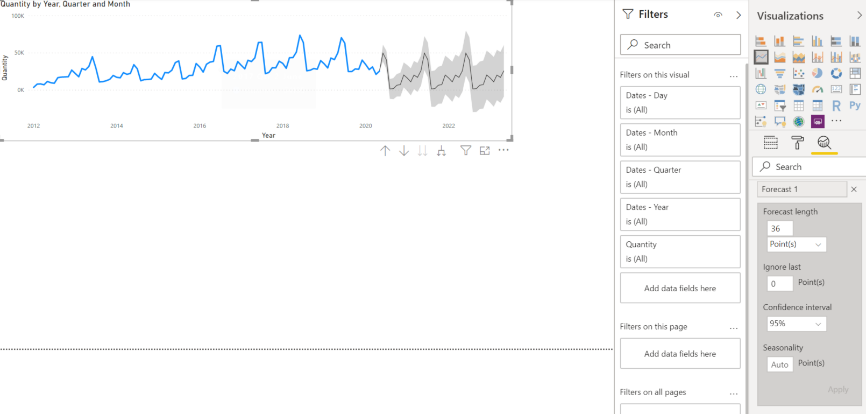
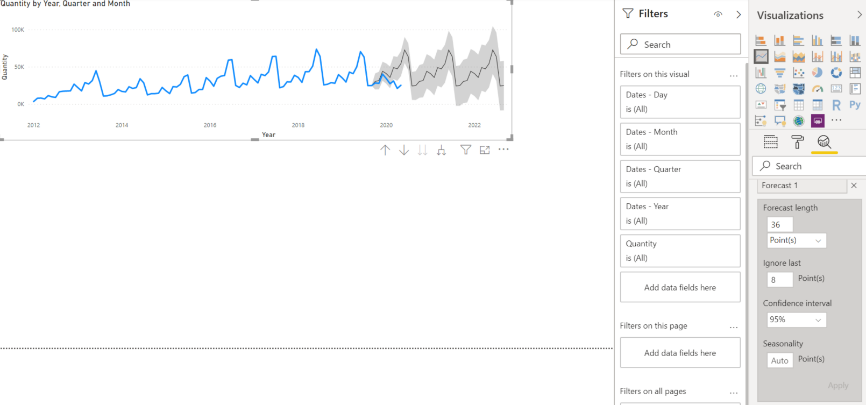
Power BI has a brand-new visualisation engine

Microsoft have built a brand-new HTML 5 compliant visualisation engine – i.e. if it’s a global map and you want to see your country/region’s sales figures, just click on that country for the stats to be revealed. Gone are the days where specialist report writers are required.

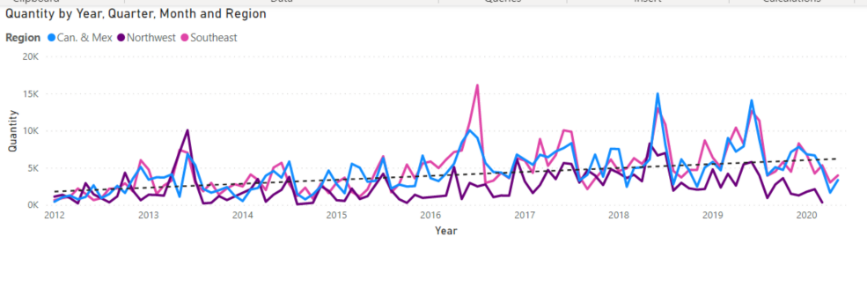
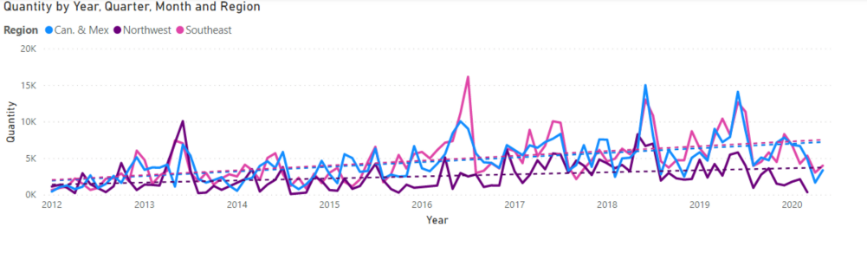
Power BI has open-source visualisations

Developers can easily copy and reuse an existing visualisation. They’ve delivered some amazing quality visuals and they’re only getting started.

Power BI is built for Excel users – but it’s not excel

This is self-service BI at its best. The only company that can improve on the UI for the business user community is the same company who built and gave us excel.

Power BI is in the Cloud

The whole of the world is moving to the cloud. Power BI was originally built with the cloud in mind – and the prime fear of security for those not yet in the cloud can be laid to rest with the industrial levels of security in place.

on-premise only? No problem

Not every organisation out there is ready to move to the cloud so there is also a Power BI product that allows a company to keep their data on-premise.

Learn more about how to embrace the power of Power BI on one of our training courses, or look out for part 2 of this blog…

Categories
Power BI

Improve Decision Making with the Analytics Pane in Power BI

With the Analytics Pane in Power BI, you can quickly and easily make dynamic reference lines, which can be extremely helpful when analysing data and making key business decisions. From simple trend lines to more complex forecast lines, there are so many options to choose from!

First, find the analytics pane by going to the visualizations pane:

Power BI visualisations line

The Trend line

If your data “jumps” up and down it can be difficult to see if you have a positive or negative trend, so here a trend line is handy.

To add a trend line:

  • Select your visual
  • Click on the down arrow before the trend line option
  • Click add on the analytics pane

The settings/options will then appear and you will see the trend line on your visual.

Power BI visualisations line

With all lines, you have the option to change the colour, style, and transparency. If you change the Combine Series option in the Trend Line setting to Off, it will display a trend line for each subcategory, which is useful for drilling down into the data.

Combine series On:

Power BI visualisations line

Combine series Off:

Power BI visualisations line

The Constant line

A constant line can be very useful, for example if you have a target and you want to see at a glance if your values are below or above the target.

Power BI visualisations line

To add a constant line:

  • Select your visual
  • Click on the down arrow before the constant line option
  • Click add on the analytics pane
  • Enter the value for the constant line

The Min line

The Min line will add a line showing the lowest value on the visual, and again you have the options to change the colour, style, and transparency.

Power BI visualisations line

The Max line

The Max line shows the highest value on the visual.

Power BI visualisations line

The Average line

The Average line shows the calculated mean average of all the values you have on the visual, which is great for showing the variation.

Power BI visualisations line

The Median line

The Median line will add a line showing the median of all the values you have on the visual.

Power BI visualisations line

The Forecast line

The Forecast line is very useful, especially if your data displays seasonality. Power BI is very good at handling complex levels of periodic seasonality, the only limitation is your date table. Fortunately, if you have week number, financial year, financial quarter, financial month, or other periodic breakdowns in your date table, they can all be used to visualise seasonality and forecast very accurately.

Sometimes, you may look at your forecast and doubt how accurate it is. For example, in the visual above the forecast shows a decrease over the next 36 months, but this is wrong. The issue is that we haven’t received all the data for the last three months, and this is having a negative effect on the forecast. Luckily, there is an easy way to fix this – you can ignore points!

Power BI visulisation

In the example above, 8 points (8 months) have been ignored. This not only takes care of the issue, but also allows you to see how close your forecast line fits your actual values. This will give you a clear indication of the forecast line’s accuracy

Also, the confidence level is set to 95% and the seasonality to Auto. The confidence level is displayed on the visual by the grey area around the forecast line. Why Auto? This means if you change the visual, Power BI desktop automatically picks up the seasonality (4 if looking at quarters, 12 if looking at years).

Conclusion

Creating insightful scenarios in Power BI can help you make powerful business decisions quickly. The Analytics Pane and the amazing tools inside it are just one small area of this incredible application.

At STL we offer a range on Power BI training courses, for complete beginners to advanced users, so get in touch to find out more!