This question is not quite eligible for to be a QI question but still worth knowing.
A document can look a bit bland without diagrams, and if you can’t get your point across quickly and easily, it can affect a business decision, project plan or sales analysis.
A graphic or diagram can be much easier for a reader to digest complex data compared to several paragraphs of text.
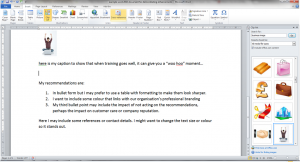
Clip Art
Clip Art can be anything from a piece of stock photography, drawings or movie.
These can be used to illustrate a point or concept in your documents.

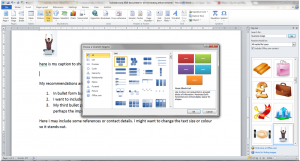
SmartArt
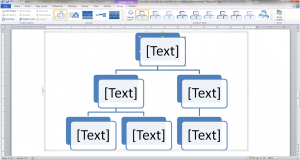
These graphics are more dynamic. They can be uses to illustrate a process model, organisational charts or even Venn diagrams.
Word 2010 gives a complete menu to choose from. I love this tool, as it saves me trying to design models or diagrams and fretting with margins. I can focus on adding the content to the image, and get my message across in my Word document.

For example, if I need to add an organisational chart, I can select a ready made model and alter it to fit my needs. I can edit it, resize it, and change the colour scheme, all with a few clicks.

Word advanced options include embedding videos, resizing images, rotating images and oh, so much more. Make a start by experimenting by adding images and editing them, and keep on learning.

