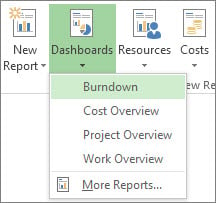
When managing a project using Microsoft Project, stakeholders often need to receive progress updates. Because not everyone can read a Gantt chart, MS Project comes with a set of pre-designed reports and dashboards to help you better understand your data. You can easily create amazing reports with Microsoft Project. Below is an explanation of the different types of report that can be created.
Dashboard Report Types
Burndown
How much is completed on a project and what’s left to be done.
Cost Overview
The current status of top level tasks showing planned, remaining costs and cumulative costs.
Project Overview
How much of your project is complete, upcoming milestones, and tasks that are past due.
Upcoming tasks
The work that has been done in the current week, the status of any remaining tasks that were due, and what tasks are starting in the next week.
Other Report Types
Cash Flow
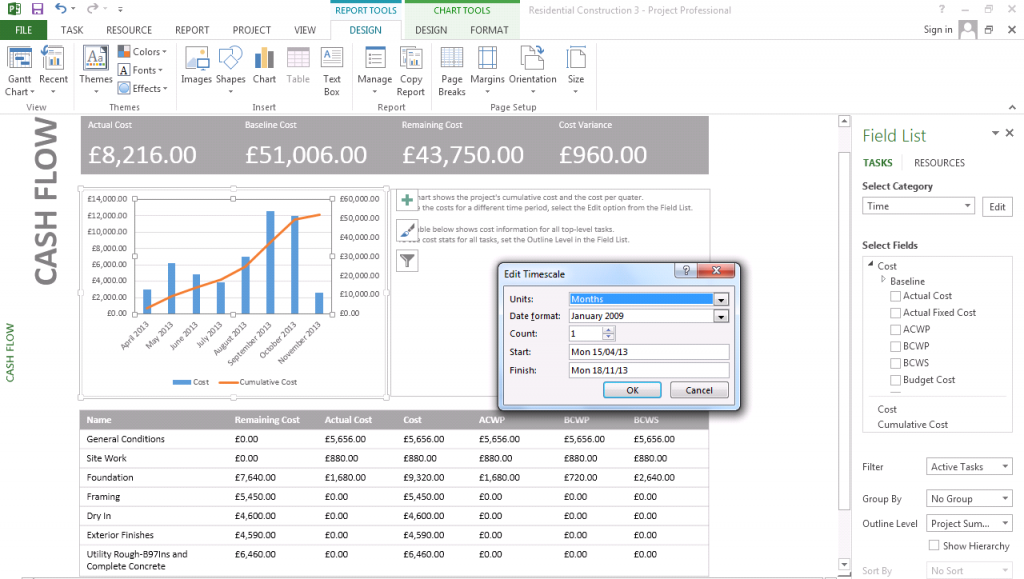
The cost and cumulative cost per quarter for all top level (summary) tasks.
Resource Cost Overview
The cost status of work resources showing cost details in a table and a chart showing cost distribution.
New Reports from templates
Chart
A chart for your project data, showing actual work, remaining work, and work by default.
Table
A table for your project data, showing the Name, Start, Finish, and % Complete fields.
Comparison
Two charts side-by-side, showing the same project data.
Visual Reports
View visual reports instantly in Excel or Visio
In MS Project, you can also view specific project data as a visual report in Excel or Visio, if you have those programs installed. Select Reports, Visual Reports, select an Excel or Visio report for your project data, and click View. Excel builds a local Online Analytical Processing (OLAP) cube file and shows your data in an Excel PivotChart or Visio PivotDiagram. This is a legacy feature from MS Project 2010 and earlier.
Examples of Reports
Here are a few visual examples based on a sample project.
Cost Overview
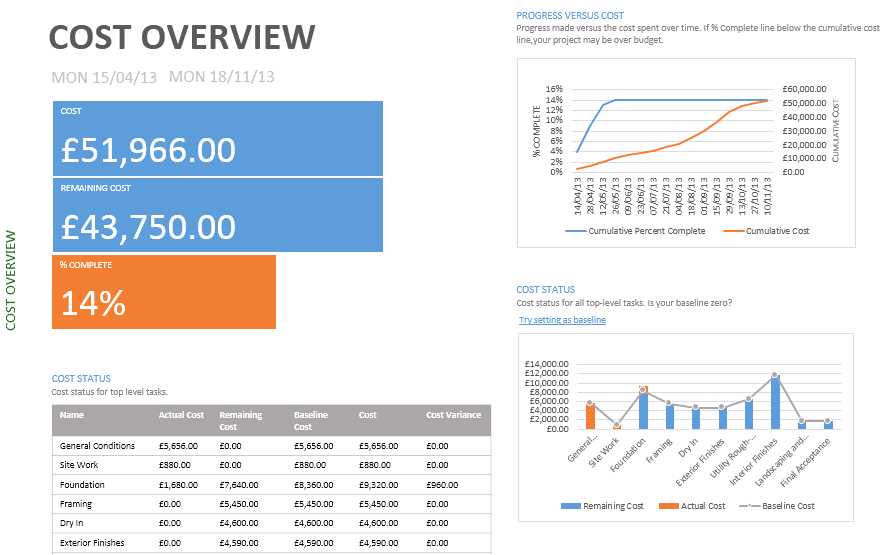
The Cost Overview report shows the following:
- Costs, Remaining Costs and % complete.
- A chart of cumulative costs.
- A chart of cost status for top level tasks.
- A cost status table for top level tasks.
Reporting changes to a project
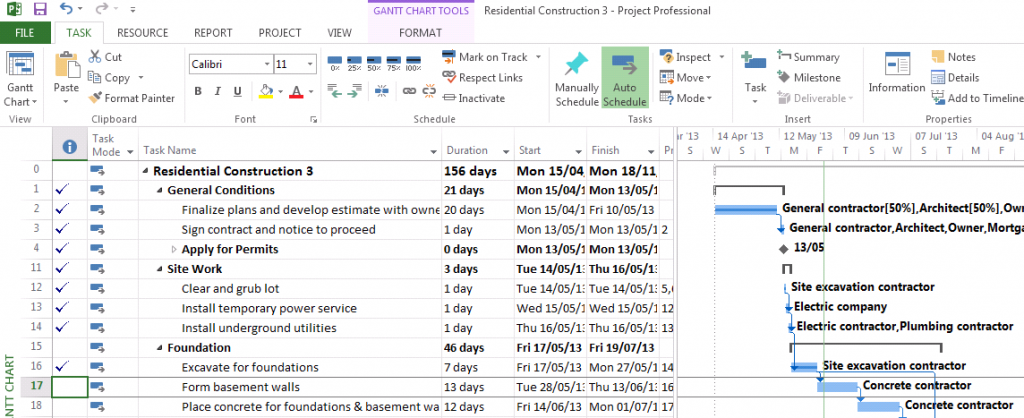
In the same example, the first two phases of the project were completed as planned. There is a delay of 4 days with excavation due to bad weather. The project plan shows which tasks are complete.
The Cost Overview Report now reflects the changes made and shows the project as 14% complete. The Cost Status table identifies the cost variance for the Foundation phase.
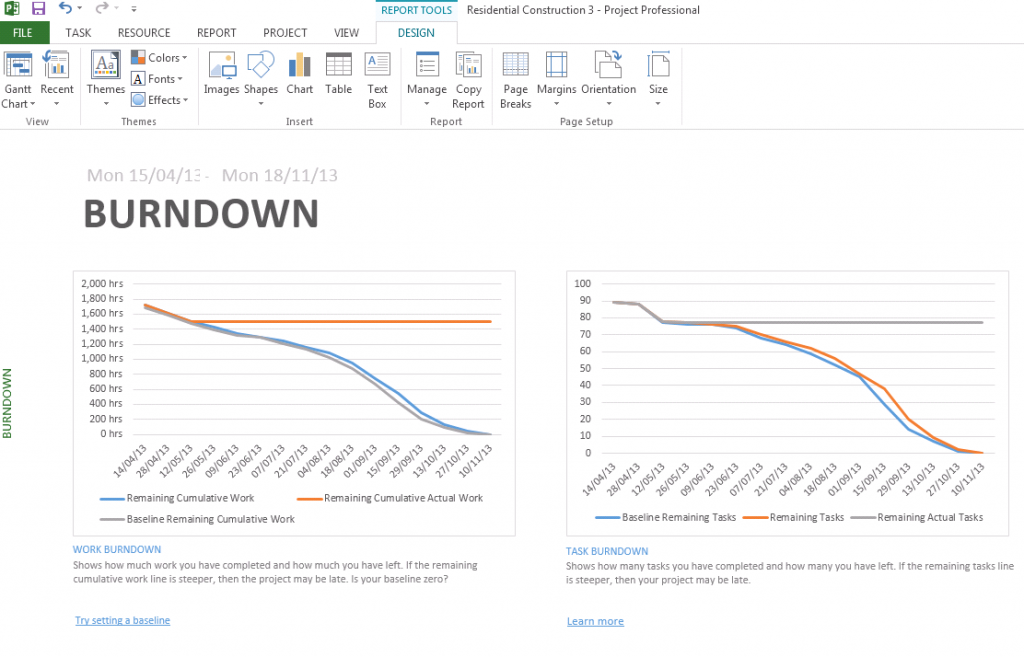
Burndown
Select Report, Dashboard, Burndown to show graphically how much work and how many tasks are completed as well as what’s left to be done.
Overallocated Resources Report
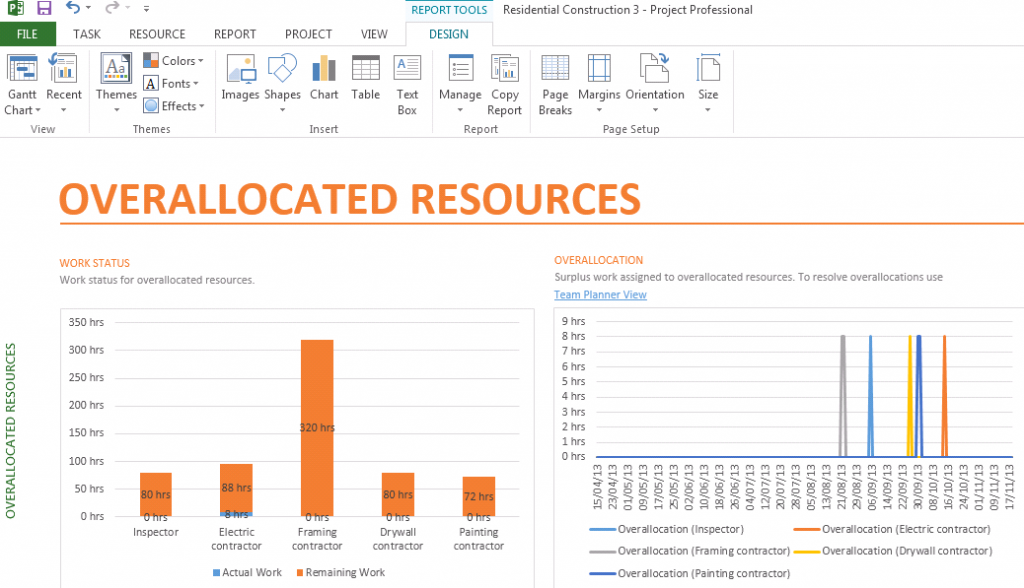
Select Report, Resources, Overallocated Resources to identify which resources are overallocated and at what points in the project. This is a great way of seeing where unnecessary costs are being lost.
Cashflow Report
Being able to report and analyse your cash flow visually is a great way to track the spend of a project. It also makes the data digestible and ideal for sharing with clients and colleagues via email or PowerPoint presentation.
Select Reports, Cost, Cash Flow to see a chart and table of the project cash flow.
To change the timescale of the report from quarters to months:
Select the chart, click the Edit button for the Time category in Field List and choose Months.
To learn how you can create amazing reports and project plans with Microsoft Project, why not consider an STL training course on Microsoft Project.
