Power BI, Microsoft’s powerful business analytics tool, continues to progress rapidly.
It continues to enable organisations to extract valuable insights from their data easily.
Several exciting features have been introduced recently, further improving its capabilities and user experience. In this blog post, we’ll explore some of these new features.

Improved performance and scalability:
Microsoft continues to prioritise performance and scalability improvements in Power BI. With the latest update, users can expect faster loading times for large datasets and improved responsiveness when interacting with visualisations, even in complex reports.
Improved data connectivity:
Power BI now offers increased connectivity options, allowing users to seamlessly connect to a wider range of data sources. Whether your data resides in cloud-based platforms like Salesforce, Google Analytics, or on-premises databases, Power BI provides the necessary connectors to access and analyse your data effortlessly.
Advanced collaboration features:
Collaboration is key to effective data analysis and decision-making within organisations. Power BI introduces sophisticated collaboration features, including improved sharing options, enhanced commenting capabilities, and whole integration with Microsoft Teams, supporting teams to collaborate more efficiently on data analysis projects.
Improved visualisation capabilities:
Visualisations play a crucial role in communicating insights effectively. In the latest updates, Power BI introduces new visualisation types, customisation options, and formatting features, empowering users to create more compelling and interactive reports tailored to their specific needs.
Improved accessibility and usability:
Accessibility and usability enhancements are central to ensuring that Power BI remains inclusive and user-friendly for all users. The latest updates include improvements to keyboard navigation, screen reader support, and visual contrast options, making Power BI more accessible to users with disabilities.
Enhanced data modelling capabilities:
Effective data modelling forms the foundation of insightful analytics. With the latest update, Power BI introduces enhancements to its data modelling capabilities, including support for complex relationships, calculation groups, and compound models, enabling users to create more sophisticated data models to build their analysis.
Streamlined deployment and management:
Utilising and managing Power BI content across an organisation can be complex. The latest update introduces new features to update deployment and management processes, including improved governance capabilities, enhanced deployment pipelines, and integration with Azure DevOps, making it easier for IT administrators to manage Power BI resources efficiently.
On-object Interaction Updates
On-object Interaction has been an available preview feature for many months and is the huge change in Power BI when it comes to creating visuals. It is a more logical and efficient way of building and formatting visuals.
When the preview is enabled, you have the visuals on the Home ribbon, and you have the option to get Power BI desktop to suggest visual. The Visualisation pane will change to a Build a Visual pane.
On-Object allow you to create the visual from the visual. Adding fields, formatting, analytical options, and now also calculations as you read about above.
The update in the February 2024 version is that now Microsoft has added multi-visual container format options! Before, when multi-selecting across different visual types, the format pane did not support any support for formatting the visuals. Now, when multi-selecting different visuals, Microsoft has added formatting support for container formatting such as changing the size, background colour, adding a shadow or turning on/off titles in bulk.
Visual Calculations
You can now perform calculations directly on visuals using DAX calculations. This feature simplifies complex data manipulation within Power BI.
Unlike traditional measures or calculated columns, visual calculations are not stored in the model. Instead, they are associated with a specific visual element.
Visual calculations can refer to any data within the visual, including columns, measures, or other visual calculations.
Advantages of Visual Calculations:
Simplicity
Visual calculations simplify the process of writing DAX by allowing you to focus on the specific context of the visual.
Performance
Visual calculations operate on aggregated data, which often leads to better performance compared to measures that work at the detail level.
Flexibility
Since visual calculations are part of the visual, they can refer to the visual’s structure, providing more flexibility.
How to Enable Visual Calculations
Go to Options and Settings > Options > Preview features in Power BI Desktop.
Enable the Visual calculations option.
Restart Power BI Desktop for the changes to take effect.
Creating Visual Calculations
Select a visual in your report.
Click the New calculation button in the ribbon.
The visual calculations window opens in Edit mode.
You’ll see the visual preview, a formula bar, and the visual matrix.
Write your DAX calculation in the formula bar, referring to the data within the visual.
Use Cases for Visual Calculations:
Running Sums
Easily create running sums or moving averages directly on visuals.
Custom Aggregations
Define custom aggregations specific to a visual.
Context-Aware Calculations
Visual calculations adapt to the visual’s context, simplifying complex scenarios.
Remember that visual calculations are a powerful tool for enhancing your reports, making DAX development more intuitive, and improving overall performance. For more details, you can refer to the official documentation.
Example 1 – use a template
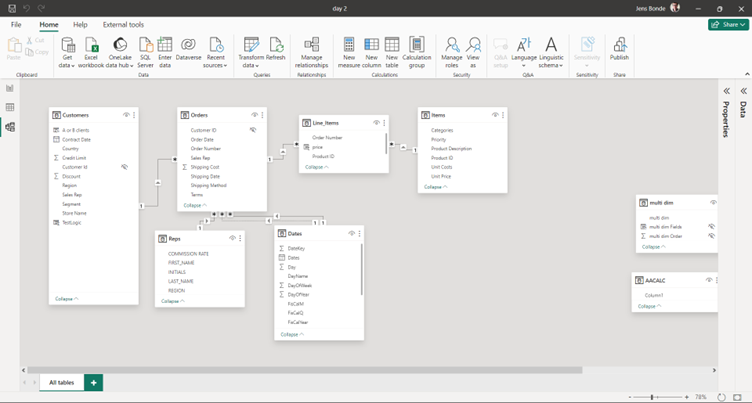
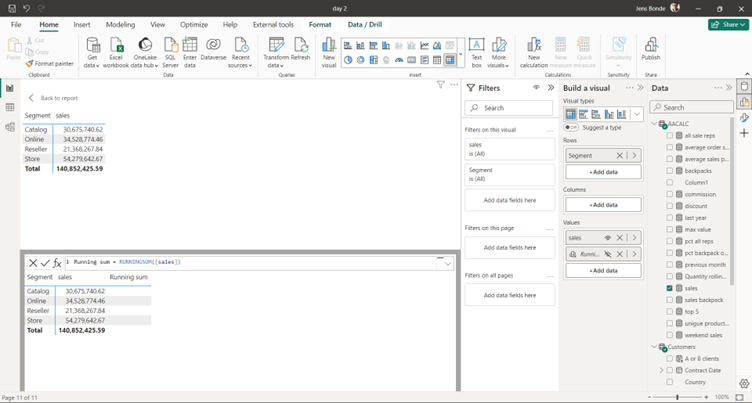
The data model is sales data and a matrix visual with sales segments and sales totals has been added to a page and the visual is selected.
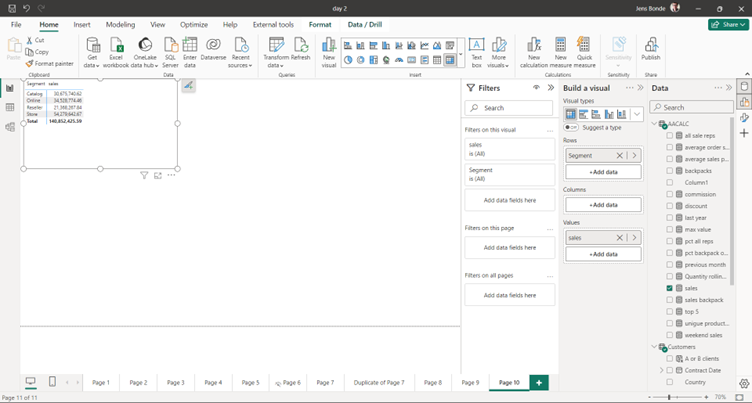
To add a calculation to the visual you need to click New Calculation on the Home ribbon and a Formula bar will appear under the visual.
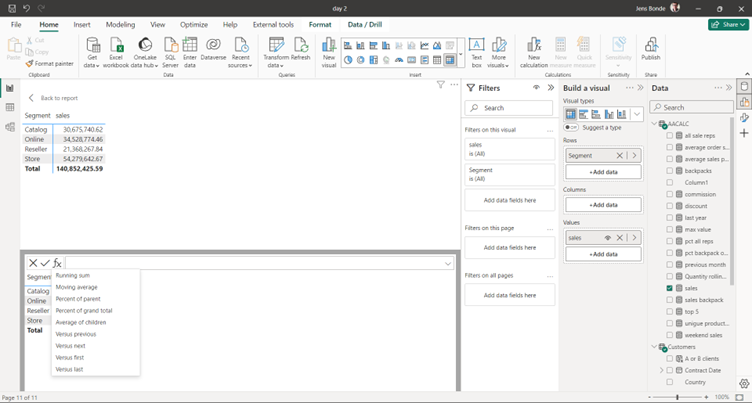
You have now different options to write the DAX calculation. You can write the DAX calculation in the formula bar, or you can press FX before the formula bar and use the listed template options.
The following templates are available:
- Running sum. Calculates the sum of values, adding the current value to the preceding values. Uses the RUNNINGSUM function.
. - Moving average. Calculates an average of a set of values in each window by dividing the sum of the values by the size of the window. Uses the MOVINGAVERAGE function.
. - Percent of parent. Calculates the percentage of a value relative to its parent. Uses the COLLAPSE function.
. - Percent of grand total. Calculates the percentage of a value relative to all values, using the COLLAPSEALL function.
. - Average of children. Calculates the average value of the set of child values. Uses the EXPAND function.
. - Versus previous. Compares a value to a preceding value, using the PREVIOUS function.
. - Versus next. Compares a value to a subsequent value, using the NEXT function.
. - Versus first. Compares a value to the first value, using the FIRST function.
. - Versus last. Compares a value to the last value, using the LAST function.
.
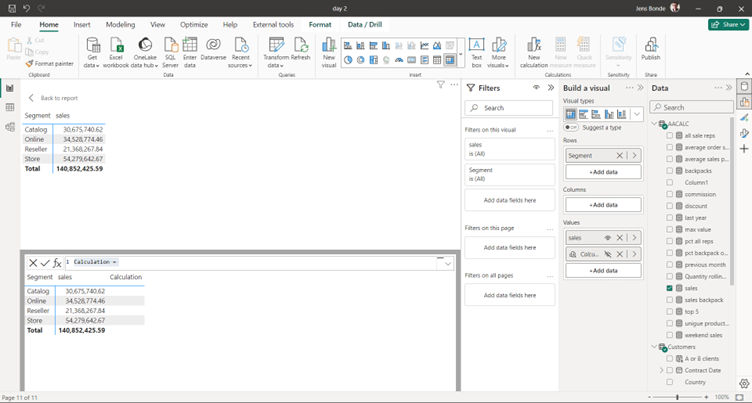
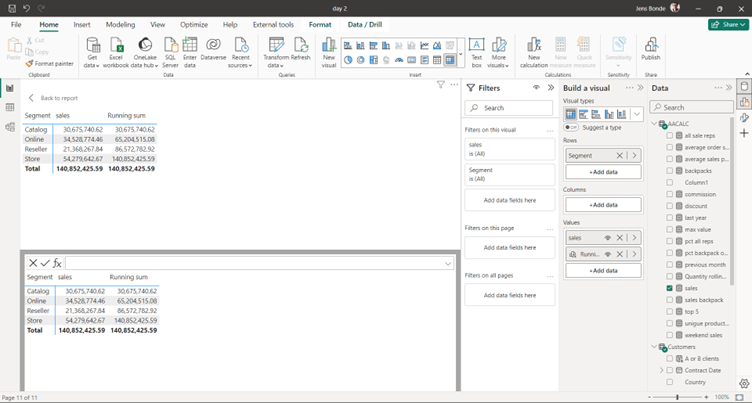
In the example below Running sum has been selected. You will have to enter the field from the visual you want to calculate (here the sales field) and when you press enter the new calculation is added to the visual.
And you will find the new calculation under Values for the visual where the new calculation can be amended or deleted, if this is what you want.
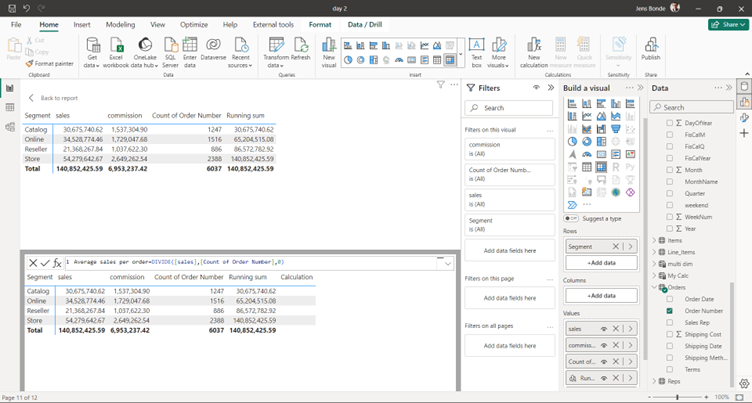
Example 2 – write the DAX
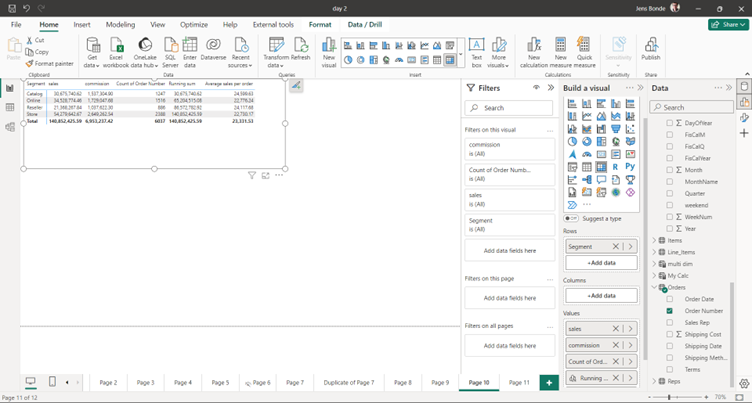
The average sales per order needs to be displayed and calculated on the visual.
The DAX looks like this:
Average sales per order=DIVIDE([sales],[Count of Order Number],0)
When the visual calculations have been done, you will have to click top left on the page you find < back to report and you will see the result on the report page.
Power BI Home
The Power BI home provides a centralised location for all your Power BI desktop activities, making it easier to manage your work.
Purpose and Functionality:
Centralised Hub
Power BI Home serves as a central location within the Power BI ecosystem.
Consolidation
It consolidates various tasks and features, eliminating the need to navigate through multiple menus.
Productivity Enhancement
The goal is to enhance productivity by making it easier to discover and consume content.
Where to Find Power BI Home:
Power BI Desktop
In the Power BI Desktop application, you’ll find the redesigned Power BI Home. It’s a familiar and centralised “home” for all your Power BI activities.
Power BI Service
After signing in to the Power BI service, you can access Power BI Home from the navigation pane.
Features and Areas in Power BI Home:
Content Discovery
Power BI Home displays relevant content based on your usage and preferences.
Recent Reports and Dashboards
Quickly access recently viewed reports and dashboards.
Favourites
Mark your favourite reports and dashboards for easy retrieval.
Shared with Me
View content shared with you by others.
Featured Content
Discover featured reports and dashboards.
Recommended Content
Get personalised recommendations based on your usage patterns.
Notifications
Stay informed about updates, comments, and other activities related to your content.
Quick Access to Tasks
Perform common tasks like creating new reports, opening existing ones, and managing datasets.
Benefits of Using Power BI Home:
Efficiency
Instead of searching through different sections, you can quickly find what you need.
Customisation
The content displayed is tailored to your interactions, making it more relevant.
Streamlined Workflow
Whether you’re a report creator or a consumer, Power BI Home streamlines your workflow.
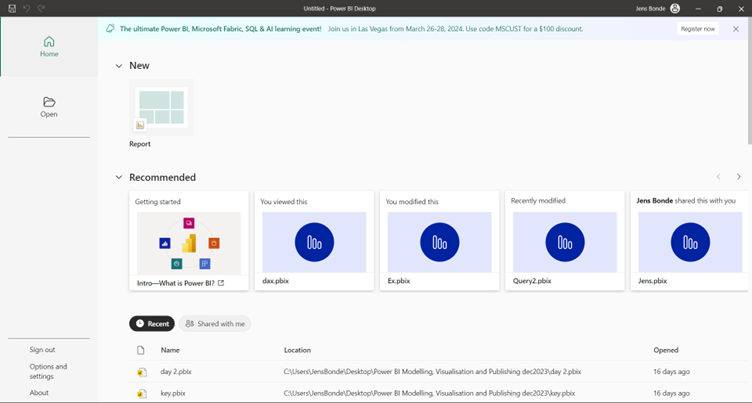
Power BI Home in Desktop is Enabled by Default
When you open Power BI version February 2024 the first time, you will get a surprise. Microsoft has removed the normal welcome screen and replaced it with a new screen, which looks more like that you have opened Power BI service.
If you are not signed into your Power BI account Power BI will ask you to sign in.
The new welcome screen will then give you quick access to all recent used Power BI files both your own files and files shared with you.
You will have quick access to Options and Settings and About where you can check which version you have installed.
Conclusion:
The February 2024 update for Power BI brings resources of new features and enhancements that redefine the data visualisation experience.
From the introduction of Visual Calculations to the refinement of On-Object Interaction and the refurbished welcome screen, Microsoft continues to innovate, empowering users to extract meaningful insights from their data with unprecedented ease and efficiency.
As organisations strive to leverage data-driven decision-making, these enhancements position Power BI as a cornerstone tool for driving business success in the digital age.
Further Reading:
If this is interesting to you, make sure to keep an eye out for out next Power BI update blog coming soon!
In the meantime, Power BI – What is Dax? Blog
What is Power BI? Infographic
What is new in the March 2024 Version of Power BI? – blog