If you make user of Slicers in your PivotTables and PivotCharts, you will be very comfortable with the timeline feature.
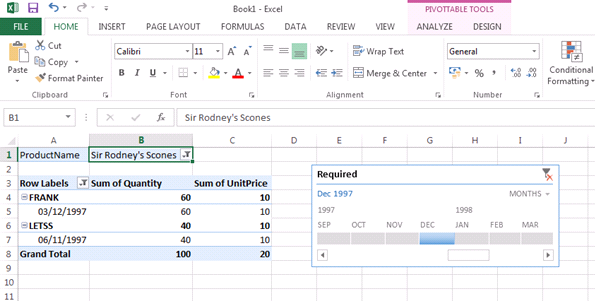
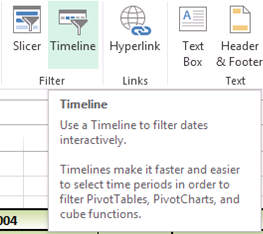
- To add a Timeline, click in your PivotTable data area and from the Analyse ribbon select Insert Timeline from the Filter group.
- Select the date field required and your Timeline is now ready to be used to filter your date field chosen.
- You can change the specified dates by simply dragging each end of the timeline.
In the real world this could be a particularly handy tool on your performance dashboards. Once you’ve set everything up, you can then let users build their own view on the data.
For more tips and features on Excel 2013 and other versions, browse MS Excel Training courses from Best STL, available London and UK wide. Speak to our a member of our team today to discuss the latest training offers along with your specific requirements.

