You can improve efficiency and accuracy when pulling and transforming data from various sources by using the Query Editor Tool in Power BI. It’s a marked improvement on using macros in Excel for this function. Read on to see why.
Why use the Query Editor
The Query Editor is where data sourced from a variety of locations can be transformed before loading data into Power BI Desktop to create visuals. It works by making a connection back to the original data source so that whenever changes are made, they are saves as ‘Applied Steps.’ Importantly, they are stored in memory. Meaning that if source data is periodically changed or added to, then a simple refresh in Power BI desktop is all that is needed to update any report visuals based on that data. The process of cleansing and reshaping data can include:
-
-
- replacing values and errors
- removing duplicates
- applying Trim to remove unwanted spaces
- merging and appending data
- adding/removing columns
- unpivoting columns
-
One of the most common problems with analysing data is when the column structure is too rigid – see below:
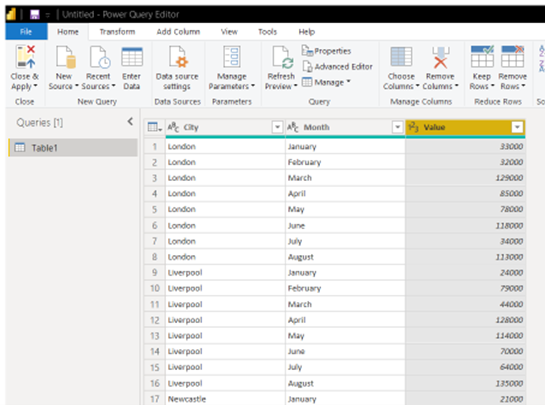
If you needed to produce reports on each city’s first 6 month’s sales, this would be tricky to accomplish given the current structure. However, there is a solution by using ‘Unpivot Columns’ in Query Editor which effectively restructures the table to produce ‘Month’ and ‘Sales’ columns in addition to the ‘City’ column.
How to use Query Editor
-
-
- In Power BI Desktop, connect to the source data: GET DATA > EXCEL WORKBOOK
- Browse to the Excel Workbook and select the data table in the Navigator dialog box
- Click on the ‘Transform Data’ button (bottom right) to launch Query Editor
-
-
-
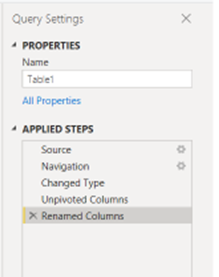
- Note the ‘Applied Step’ section on the right that will expand to include further steps
- Now select all the Month Columns, right click on the selection and select ‘Unpivot Columns’ from the list
- Rename the ‘Attribute’ column ‘Month (see below)
-

Notice the new structure and also the additional ‘Applied Steps’. To complete the process, apply the changes back to Power BI desktop:
-
-
- In the Home tab, select ‘Close & Apply’
- Create a Column Chart showing Value (sales) against Month
- Check in the Data view to see the updated data and new column structure
- Now add September’s sales in the Excel table. Save and close the file
- Finally in Power BI desktop, select REFRESH in the Home tab and check the chart and data have both updated
-
Conclusion
The Query Editor is a powerful and extremely useful tool allowing you to repeat routine cleansing tasks on your datasets without the need to do it all manually. This tool will therefore help you become more efficient in the way you manage data. In doing so, you will ultimately increase your productivity.
Further Reading
To find out more about Power BI and when to use Power BI vs. Excel, feel free to have a peruse of the following conversation with one of our trainers: https://www.stl-training.co.uk/b/excel-or-power-bi-which-is-better-for-business-reporting/


