Categories
PowerPoint Training

Using Rehearse Timings in Powerpoint

After all your hard work developing your slides, it’s definitely worth running through the whole presentation to see how long the whole presentation takes.  This is the opportunity to edit down the slides if you find you are over-running or finetune your speaker’s notes to help you run to time.

With your presentation open, select the Slide Show tab.

Slide-show-tab-advanced-powerpoint
The Slide Show tab has everything you need to make your presentation run to time.

Select the Rehearse Timings in the Set up section of the Slide Show tab.  This function will run the presentation in full screen view, recording the timings.  So when you click N for the next slide, the timer will start afresh for the next slide.  When you reach the end of your presentation, you can view the timings for each of the slides.
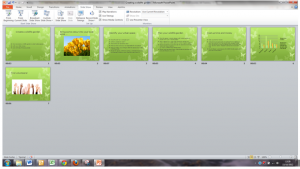
slide-show-with-rehearse-timings-listed-advanced-powerpoint
The individual timings for the slides are shown underneath each one.

It is a really useful tool to help you prepare your presentation and feel more confident with your delivery on the day. To build on these tips, there are more functions detailed in our  PowerPoint intermediate/advanced course part of our range of PowerPoint training courses London.


Categories
PowerPoint Training

How to insert Excel data into a Powerpoint presentation

This is another thing I didn’t realise that Powerpoint could do.

Using my garden project presentation, I want to add a basic chart  from scratch that compares the costs of sourcing plants from a nursery, from donations or cuttings, or a combination of the two.

Luckily, Powerpoint led me through the process for adding basic information to make bar chart.

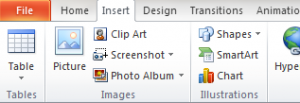
I clicked on the Insert tab and selected Chart, which is located in the Illustrations menu.

Insert-tab-bar-chart-excel-powerpoint-courses
My Excel bar chart can be created using the Insert tab, and Chart option located in the Illustrations section.

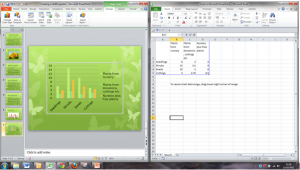
When I selected the bar chart, Powerpoint opened up an extra screen with the key headings for my chart.  I then added the data I wanted.  The chart was updated as I worked.

insert-excel-data-presentation-excel-powerpoint-training
You can work with Powerpoint and Excel side-by-side to add data to an Excel sheet. The bar chart in Powerpoint is automatically updated.
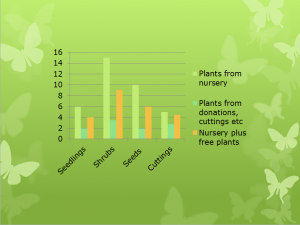
Final-chart-excel-powerpoint-courses-example
The Excel data is now in a bar chart in Powerpoint.

This is a really simple example of inserting Excel data into a Powerpoint presentation, using new data.  It’s a good start, and now I really want to build on that…time for more exploring….

For more advanced techniques in Excel and Powerpoint courses, take a look at our range of courses, from introduction, intermediate and more https://www.stl-training.co.uk/powerpoint-training-london.php and https://www.stl-training.co.uk/microsoft/excel-training-london.php


excel and powerpoint courses