Categories
Application Data Visualisation Microsoft Power BI

Comparing Power BI Desktop to the Power BI Service

The different versions and configurations of Power BI can be confusing. In this blog, we are comparing Power BI Desktop to Power BI Service. This will shed light on how to use each of these apps.

Power BI
Power BI Report
Power BI Desktop

Power BI Desktop is a free application you can download and install on your local PC. You can use Power BI Desktop to connect to, transform, and visualize your data. Furthermore, you can analyse your data and develop reports. The Query Editor in Power BI Desktop manages the connections to the data sources. It can structure, clean, merge, and append data. You are then able to combine the data into a relational data model. From the data model, you can design reports using the visualisation tools in Power BI Desktop. Power BI Desktop is the only app of the two which allows the creation of DAX (Data analysis eXpressions) measures, calculations, and column calculations. You can set up role level security (RLS). You can use RLS to manage the data each person in the audience has access to in a published report.

the Power BI Service

The Power BI Service is known as Software as a Service (SaaS), which is a cloud-based service. You can edit reports, share the reports with your audience, and collaborate with teams and organizations. You can connect to certain data sources, but its modelling capability is limited. The Power BI Service cannot perform DAX measures, calculations, or column calculations. However, you can create dashboards from multiple reports using Power BI service. Furthermore, it is possible to create and distribute apps, reveal business insights, and much more.

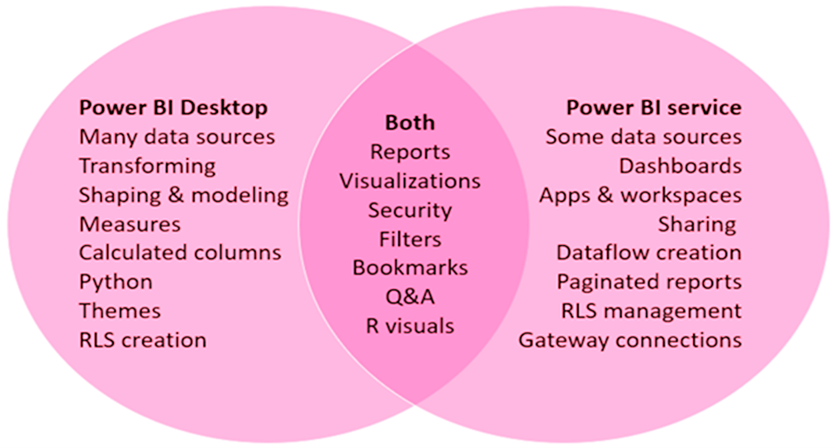
Power BI Desktop versus the Power BI service – diagram

"Comparison

The diagram above compares Power BI Desktop and the Power BI Service. As you can see, there are features common to both tools. However, certain tasks are unique to one app. The diagram also shows which features are only available in either Power BI Desktop or in Power BI Service.

Best practice is to do all the development work in Power BI Desktop, because of all the limitations you have in Power BI Service. The Query Editor is not available in Power BI Service. This means that you cannot shape, clean, merge, append, or group the data. Neither can you create data models, measures or column calculations.

Keep your activities strictly separated when using both apps. Do all development, updates, and changes to reports in Power BI Desktop. Save these changes in locally stored Power BI files. After the changes, simply publish the reports again. This will overwrite the old reports on Power BI Service. You can change the reports in Power BI Service and add more visuals, but this will not update your locally stored Power BI files.

Editing Power BI Reports

In both Power BI Desktop and Power BI Service, you can build and edit Power BI reports. A report can have one or more pages, with visuals and collections of visuals. You can also add bookmarks, buttons, filters, and drill-throughs to improve navigation in your reports.

Working in the Power BI service – Collaborating

Having created your datasets and reports, you can save them to workspaces in the Power BI Service, where you and your colleagues can collaborate. You can build dashboards on top of those reports. This enables you to share the dashboards and reports with consumers inside and outside your organization. In the Power BI Service, users can view reports in Reading view only, not in Editing view. Users do not have access to all the features accessible to report designers. You can, however, share your datasets and let others build their own reports from them.

Self-service data preparation with dataflows

Dataflows help organizations unify data from different data sources and organise it for modelling. Analysts can easily create dataflows, using self-service tools. They can also use dataflows to consume, convert, combine, and improve large data sets by defining data source connections, ETL logic, refreshing schedules, and more.

Conclusion

In  summary, when comparing Power BI Desktop to Power BI Service, best practice is to use Power BI desktop for developing reports and Power BI Service to publish, share, and collaborate with others.

STL has four Power BI courses. All four courses are based on developing in Power BI Desktop. On our Power BI Reporting and Power BI Modelling, Visualisation and Publishing courses, we include Power BI Service in the course.
Categories
Power Apps Power BI

Power BI –Power Query M functions versus DAX

Using the right tool in the Power BI Desktop can bring efficiency wins and productivity gains to users.

This blog will give you a clearer understanding about how and why this is a common issue and how to solve it. “When should you use Power Query M Functions(M), and when is it better to use Data Analysis Expressions (DAX)?”.

In short

M: Data engineering or prep

DAX: Data analysis.

First, some limitations

Only the data model owner/developer can use Power Query M functions. If you create your Power BI desktop reports from a data model published by someone else, and you do not have admin permission to change the data model, you cannot use Power Query M. If you are not the data model owner/developer and you do not have the right permission, you cannot create column calculations using the DAX functions.

Power Query M functions and DAX functions can only be used in Power BI desktop, so if you create your reports in Power BI service (the online version) you cannot use any of them.

It can be confusing because you can do a lot of the same tasks equally in Power Query M and DAX.

Example where both are applicable

Imagine the scenario, your intended audience want to see the last 4 years-worth of data. We want to work efficiently, so cleaning the report by deleting the oldest month every month is not something we should consider doing. We also do not want to manually update all the visuals each month.


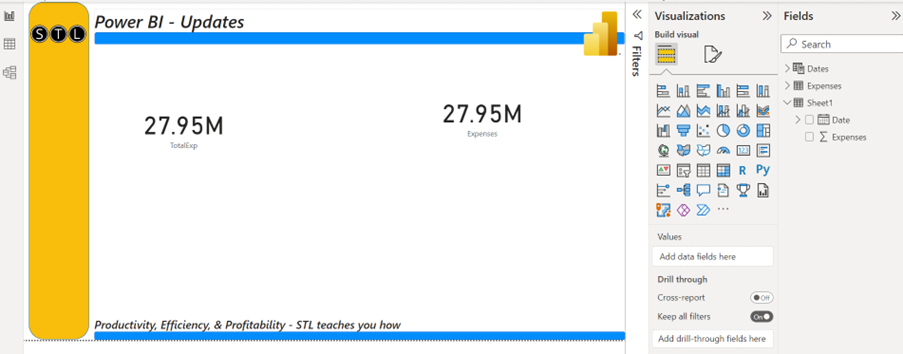
In the report below, you can see two card visuals showing the expenses from the last day previous month, and the 48 months before.


The first card result is done by DAX.


TotalExp =

CALCULATE (

SUM ( Expenses[Expenses] ),

DATESBETWEEN (

Dates[Date],

DATE ( YEAR ( NOW () ) – 4, MONTH ( NOW () ), 1 ),

EOMONTH ( TODAY (), -1 )

)

)

The logic in the DAX is that you want to sum the expenses for all dates between the date current year minus 4, the current month, and start from the first of the month.

The example below will return the exact same result but by using Power Query M.

In the advanced query editor, you can see the code the query editor writes when you connect to the sources and do tasks (also called steps).

To achieve your goal here, you do not need to write all the codes you see above. The query editor is able to write most of it for you. You just need to connect it to the source data.

The following code was added.

#”Filtered Rows” = Table.SelectRows(#”Changed Type”, each [Date] >= #date(Date.Year(DateTime.LocalNow())-4, Date.Month(DateTime.LocalNow()), 1) and

[Date] < #date(Date.Year(DateTime.LocalNow()), Date.Month(DateTime.LocalNow()), 1))

The logic in the code is very similar to the DAX code.

Check each date. If it is greater than and equal to the date, current year minus 4, current month, and the first day of the month and less than the year now, the month now, and the first of the month. It will always find the last day of previous month because it must be less than.

So which of the two options above is better practice?

Well, it depends on the situation.

As you saw at the top of this post – the most important piece to take forwards.

Power Query M functions are used for data engineering (also called data prep), and DAX functions for data analysis.

It is a huge advantage to use the Power Query M solution if the whole report only needs to show the last four years of data and if all reports created from the same data model only need the last 4 years of data. The Power Query M solution will filter the data and only store the data you need for your report through the process connecting the data source to the data model. Power BI will automatically update the report every month.

If you use the DAX solution, you filter the data from the data you already store in the data model. You may have 20 years of data in the data source. If you store a lot of data in the data model, it might load very slowly. It is always best practice to keep the data set as small as possible. If you do not filter the data in the connection, the data source will continually grow.

Conclusion

There is no clear answer to the question, should you use Power Query M or DAX, it all depends on the situation, but it is important to remember that if you are using a data model owned or developed by someone else, you will need to have admin permission to use Power Query M.

Power BI DAX and Power Query trainer, Jens Bonde, gives his opinion:

“Based on my experience, I use Power Query M to do the tasks I need for the preparation of the data sources. But after the data sources has been imported and the data model has been built, I use DAX. Living by the rule ‘M for Prep, DAX for analysis’”

STL has an Excel Power Query course and a Power Pivot course where we create data models in Excel and calculate measures using DAX.