Microsoft has created some very interesting AI (Artificial Intelligence) visuals for Power BI. Power BI offers four AI visuals – Q&A, Key Influencers, Decomposition Tree, and Smart Narrative. This article is Power BI Artificial Intelligence Visuals Part 1 – Q&A. It is the first in a series of 4 which will go through all four AI visuals.
AI visuals are very useful and all four can provide your report with insight information from your data model. Without these, you have to do DAX measures and create your own visuals.
The Q&A visual
You can use the Q&A visual to ask questions of your data model and convert the answer to other visuals.
In this example the data model is HR data, with information about the employees. The data model includes how many days of training each of the employees has done, days of sickness, holidays, and productivity. Yes, the employees’ productivity gets measured! There is also a satisfaction score. The employees fill in an engagement form each year in which they can give a score on several key points to measure engagement.
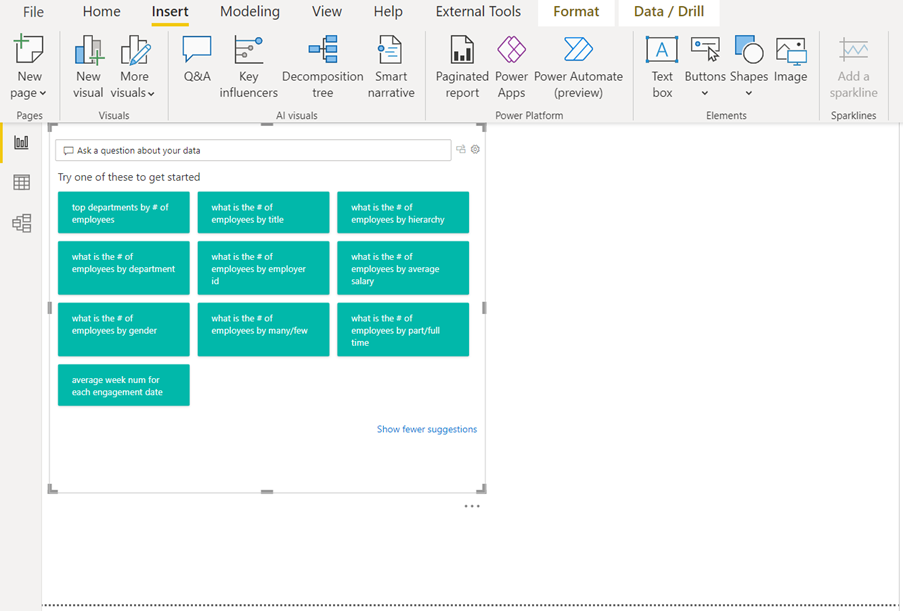
To use the Q&A visual, click Q&A on the Insert tab in the AI Visuals group. Power BI will add the Q&A visual to the report page and suggest questions you can ask.
If you find a question on the list which is of interest for your report, you can simply click on the question.
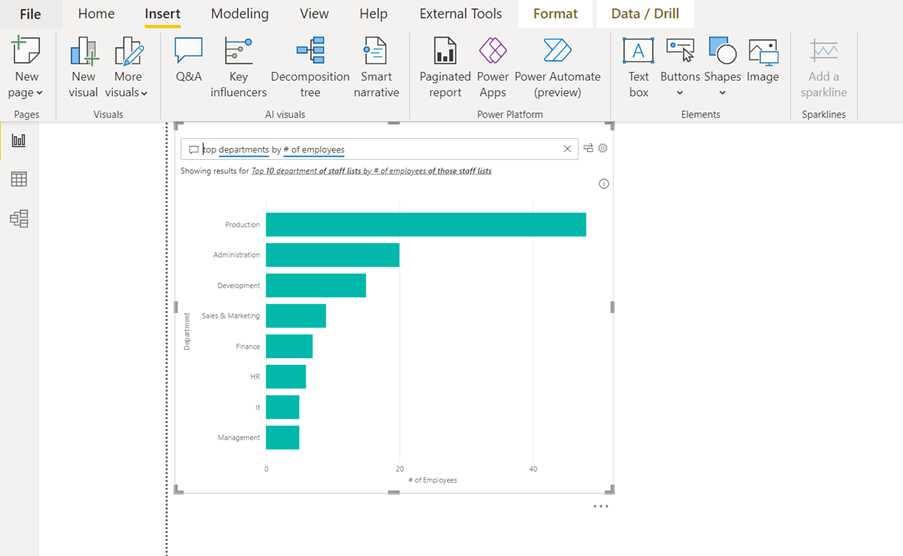
In the example below, we selected the suggested question “top departments by # of employees”. The Q&A visual shows the answer in a suggested visual.
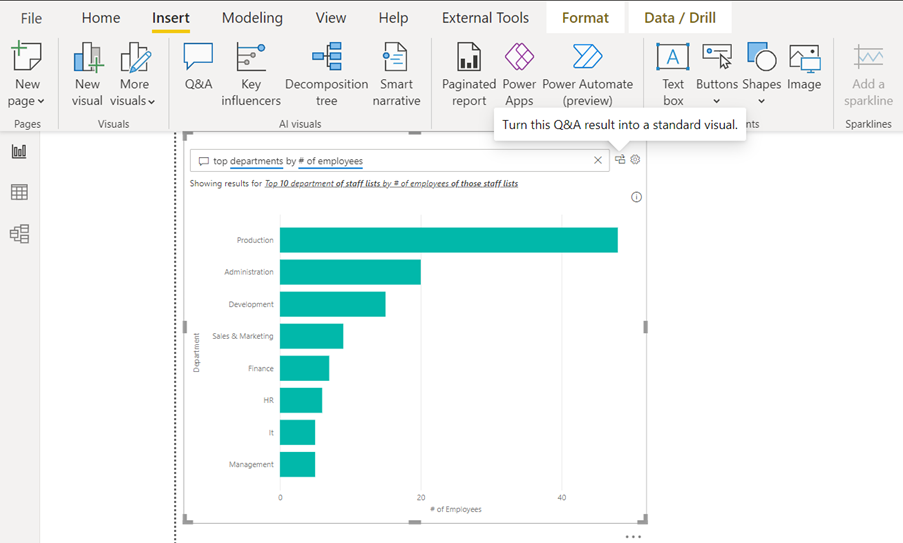
If you want to display the answer in your report, you can convert the answer to a standard visual. To do this you will have to click on the icon just to the right of the question input box at the top of the Q&A visual.
Then, Power BI will convert the Q&A visual to a standard visual If you do not like the suggested standard visual, you can of course change the visual to another standard visual.
Ask your own questions
If you want to ask your own question to your data model, you can just ignore Power BI’s suggested questions and type your own question in the question box.
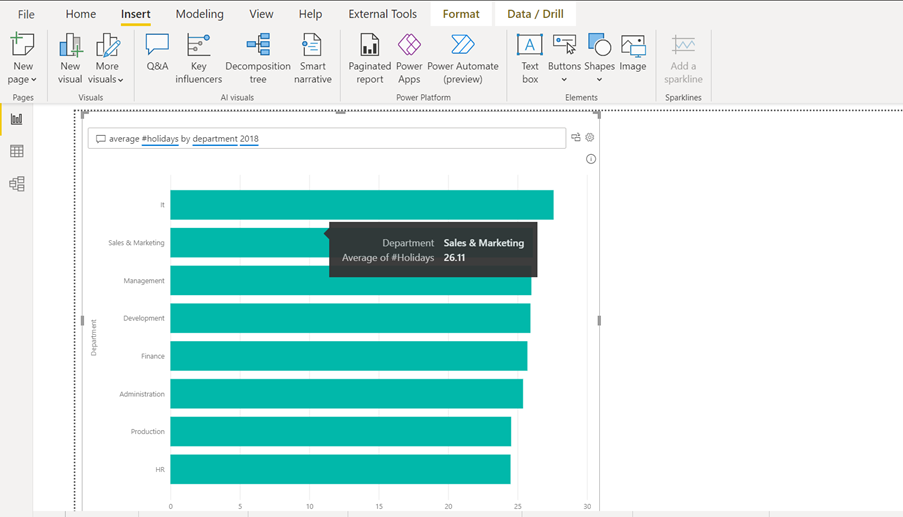
In the example below the question was “average #holidays by department 2018”. You can see the result below.
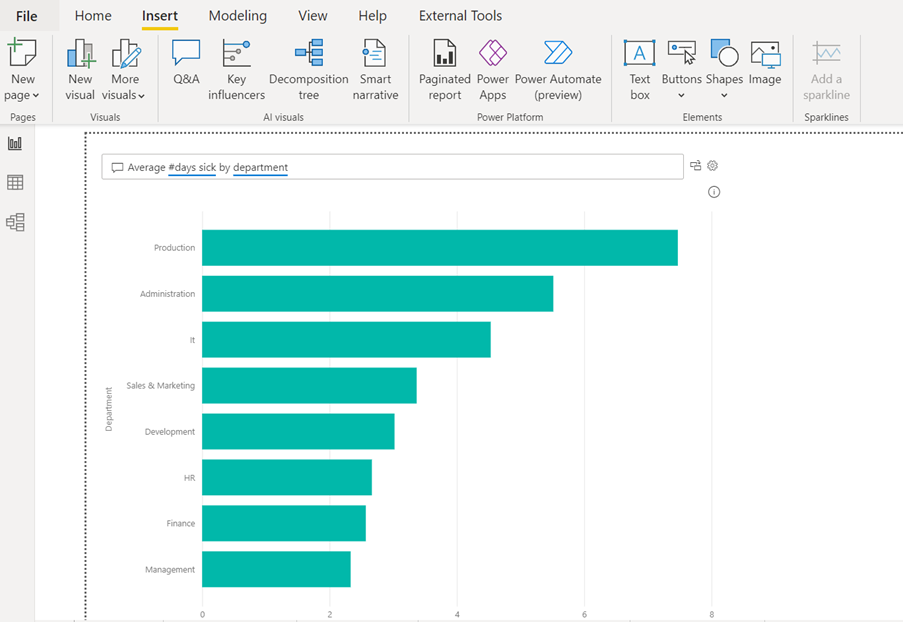
In the next example, the question was “average #days sick by department”. Here is the result.
For Power BI to understand your own questions, you have to use the headers from your tables in the questions. In the example above, there is a table in the data model where the number of days of sickness are registered. The header of the specific column is “#days sick”. In another table with the general information about the employees, there is a column in which the employee’s department is entered. The header for this specific column is “department”.
Conclusion
By using DAX measures, you can calculate similar results as in the examples. You can also create your own visuals, but the Q&A visual can do this without the need for manual input. It is also possible to create a list of your own suggested questions. When the report is then published, your audience can pick the questions they want answered from your suggested question list.
As mentioned at the beginning, this is Power BI Artificial Intelligence Visuals Part 1 – Q&A . If you want to know more about the other AI visuals in Power BI, please follow STL on LinkedIn or visit our website.
STL has two Power BI courses which include AI visuals: Power BI Reporting and Power BI Modelling, Visualisation and Publishing.
