Categories
Application Power Apps Power BI

Exploit Power BI’s Drilling tools to enhance Profitability

In Power BI, you can apply Drilling tools to certain visuals in order to ‘drill down’ through your data. It works by building fields into your visuals that take you from ‘top level’ information (e.g., Sales by Country) right down to specific sales (e.g., Sales by Salesperson) known as ‘granular data’. Drilling down will change the visual to reflect more of the detail. This blog explains the different Drill buttons and their functionality to help you improve the way you analyse your data. You will be able to exploit Power BI’s Drilling tools to enhance profitability in your company.

Why use Drilling tools

Drilling tools really help an end user/stakeholder to fully understand the detail behind a specific visual in order to drive business forward and increase profitability

How it works

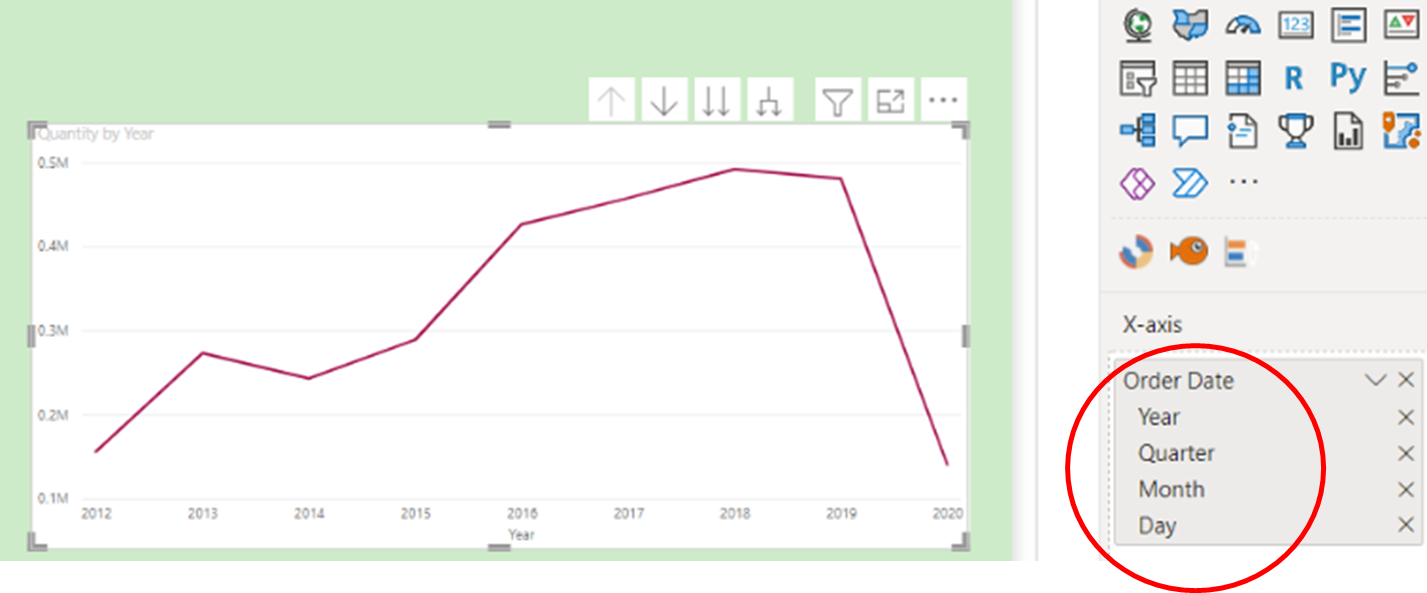
Firstly, you need to create a visual containing ‘hierarchical’ fields e.g., ‘Country’, ‘Segment’, ‘Salesperson’ in order to facilitate the drilling tools. In the following example, a line chart is used to show an ‘Order Date’ field by ‘Quantity’ where Power BI desktop will automatically support a Date Hierarchy (see below).

  1. Notice there are four ‘arrow’ buttons above the chart, each with a different function:
  1. Starting at the ‘top level’ i.e., ‘Quantity by Year’ click on 

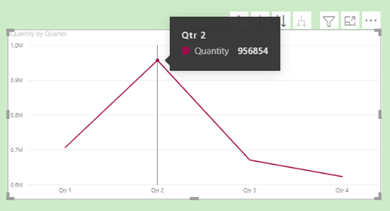
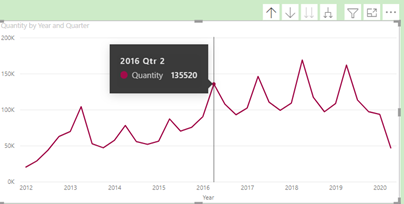
This action changes the line chart to show ‘Quantity by Quarter’ i.e., the next level down. for If you hover on the data point of Qtr. 2, it highlights the overall Quantity for Qtr. 2 over the entire 8-year period.

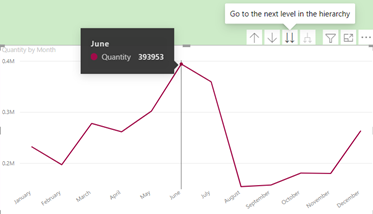
  1. Clicking on the    button again brings up another view – i.e., ‘Quantity by Month’:

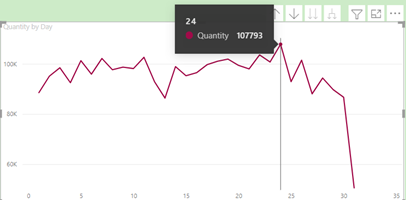
  1. Again, clicking on the      button again brings up a daily view – i.e., ‘Quantity by Day’:

Note the tooltip showing that the day in which most quantities are sold in any month is the 24th.

  1. The ‘double down’ arrow is now faded out, which means this level is the lowest level of granularity
  2. Click on the    button to go back through the hierarchical levels to the top level
  3. Now click on the ‘Pitchfork’ button   to show the next expanded level:

The tooltip is now showing all Quantities in Qtr. 2 of 2016.

  1. Click on the    button again to show the chart at month level:

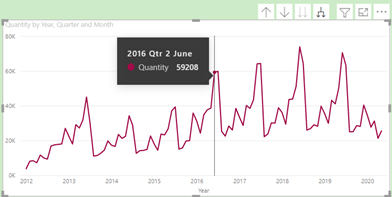
Now the tooltip is showing all Quantities in June Qtr. 2 of 2016. Let’s say you wanted to analyse the data further at day level in this particular month of June.

  1. Click on the ‘Drill Down’ arrow   to turn it on showing the following:

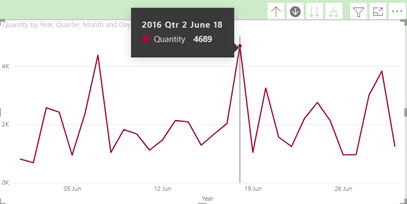
This now reveals that the highest performing day in terms of Quantity is the 18th.

Conclusion

So often in business, it is the details that can provide a competitive edge to improve performance. Having access to the various levels of data within a single visual using the Drill buttons will definitely help to achieve this goal. Exploit Power BI’s Drilling tools to enhance profitability in your company.

For course details on our Power BI Reporting course at STL, please click on the link below:

https://www.stl-training.co.uk/syl/355/power-bi-training-courses.html

For more information on Data analysis in business, please click below:

https://www.inc.com/carol-sankar/how-your-data-can-improve-your-customer-relationships.html

Categories
Application Excel Training Microsoft Microsoft Office

Solve date problems in Excel with Power Query

Today I’m asking Jens, one of STL’s top Excel trainers, if there is a quick way to fix date issues in Excel. Can I solve date problems in Excel with Power Query?

Hi Jens, do you have advice for me on how to handle date issues in Excel?

Jens: I cannot count how many times I’ve been asked about date issues during my 22 years working as an Excel trainer. “My database returns US dates.” “Excel does not see my dates as dates.” “How can I extract years, months, weeks, and quarters from my dates without adding new columns to my data set?” “Excel sees my dates as text.” “Why is time included in my dates?” The list is long, but the answer is short.

I’m all ears, Jens!

Jens: USE POWER QUERY!

In the past, I had to write complicated VBA code to handle date problems. I’ve used Left, Right, and Mid functions to extract the different parts of the dates to then concatenate it back again to a format Excel could understand as a date.

Converting US dates to UK dates

Many databases, financial applications, and other software extract dates in US format and it can be a pain for Excel users all over the world in countries with a different date format. Microsoft has made it very simple to handle these problems in Power Query.

If you simply import a date in US format into Excel, it will see a date like this: 02/28/2021, as a text string. And a date like this: 12/03/2021, as 12th March 2021, which is wrong because the actual date is 3rd December 2021.

The conversion to UK dates happens in the connection to the source data.

In Power Query, the column with US dates will look like this:

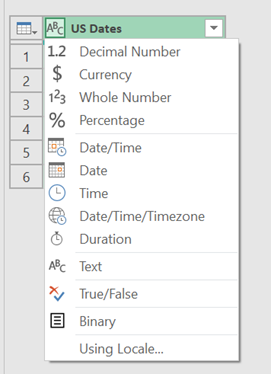
At this point, Power Query sees the US dates as text – indicated by ABC in front of the US Dates header.

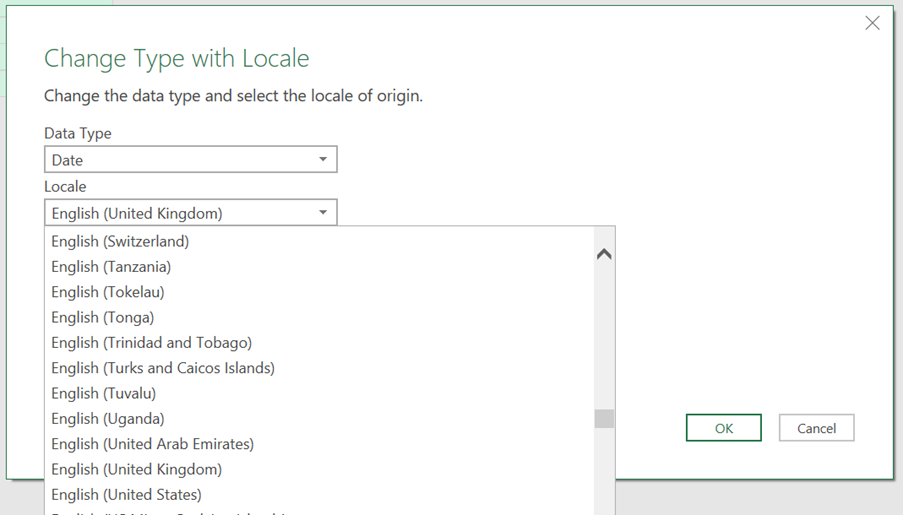
All you need to do is to click on ABC, then click Using Locale.

Select the data type Date, then select English (United States) under Locale.

The result will be in the correct date format for the country. In addition, the query connection to the source data will automatically convert the dates correctly for all future entries in the source data.

This is amazing, Jens! Could you share a real-world example with us?

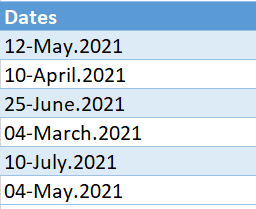
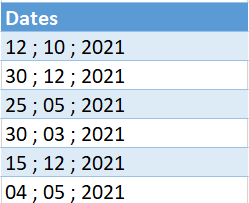
Jens: Excel can be very stubborn. I once had a client who asked for my help. She had dates formatted as you can see in the table below:

She couldn’t get Excel to understand that it was a date column. Whatever she tried, Excel kept on seeing the dates as text strings. Power Query solved her problem in 3 seconds!

If you connect a table with “dates” like these to Power Query, the app will immediately convert the column to the correct date format. You will not need to do anything else; the query will just keep doing it.

If dates contain incorrect characters, Power Query will simply replace them with the correct ones.

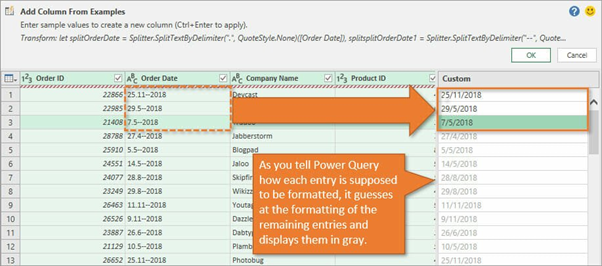
The Column From Example tool in Power Query can also handle strangely formatted date formats. If you know the Flash Fill tool in Excel, the Column From Example tool is the equivalent in Power Query.

This tool applies pattern recognition based on examples of how you have previously changed dates to the desired format.

If, for example, you have dates formatted as 30.3-2021, in the same row in the Column From Example column, type 30/03/2021. Power Query will immediately recognise the pattern and fill down the desired formatting. You may have to give the Column From Example tool more than one example to understand the pattern. However, when the tool recognises the pattern, it will apply the correct format, even for new data entries.

Once you have added the Column From Example column, you can simply remove (delete) the date column with the incorrect formatting.

Wow, this will make my life so much easier!

Jens: Power Query not only handles issues with dates, but it can also transform and group dates, and much more.

Any final thoughts about Power Query, Jens?

Jens: For me, Power Query in Excel is a genius tool which can address issues within any data, not just dates, in seconds. All Excel users should know about this tool and use it. This will increase their efficiency and have a huge impact in how much time they spend in Excel. Power Query automates tasks. Once you have shown Power Query the steps you want it to do, it will continue applying the steps to new data. This is something previously only doable by writing complicated VBA code!

STL has a one-day Power Query course which gives great insight into the power of this tool and will make you able to handle many time-consuming tasks in seconds.

Thank you Jens! Now, all Excel users can solve date problems in Excel with Power Query.