Categories
Application Hints & Tips Microsoft Power BI

Power BI – Create a Perfect Chart Visual

Power BI Desktop can work with a large number of visuals to make sure that the audience of your reports are best informed to make the right decisions. It is your responsibility to make sure that the data is presented a way, so the audience of the reports are given a clear picture of the data in an efficient, clear, and correct manner.

power

In this blog post you will see a suggested way of building a chart visual, which will show you through some of the new Power BI Desktop features.

Case study to work through

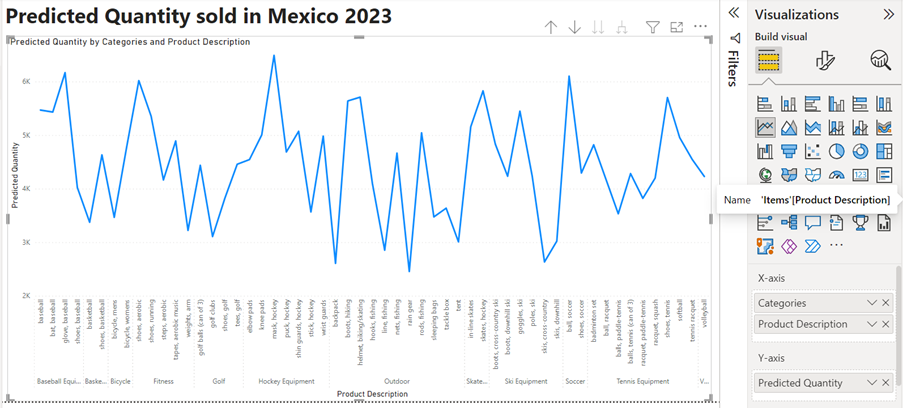
A company is selling products in Mexico and have predicted how many items they are going to sell next year. The company is working with a confidence level of 90% accuracy.

The report creator would like to visualise this as precisely as possible in a Power BI report.

Of course, a text box is important to explain the audience what they are looking at.

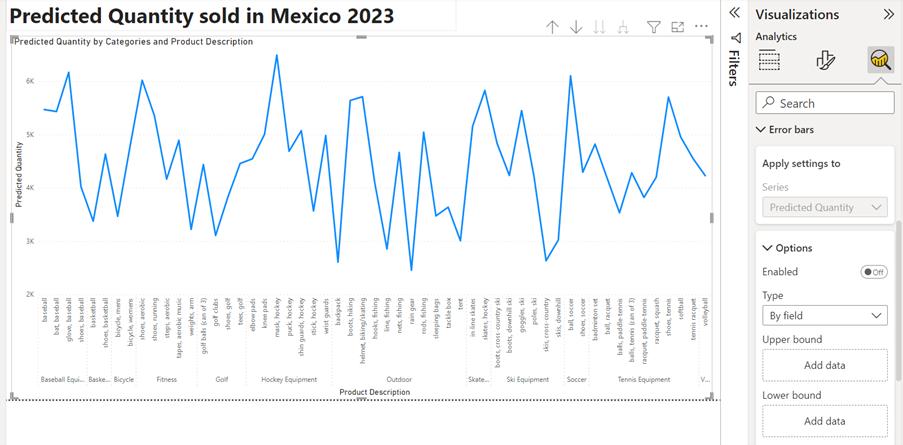
The line chart displays the measure predicted quantity by product categories and product names.

power bi

The text is almost identical in the text box and in the chart title.

You can create dynamic text boxes, which will change the text based on filters and much more. This ensures that the text displayed will give your audience a precise description of what they see in the visual.


Next step 90% confidence level for the accuracy of predictions

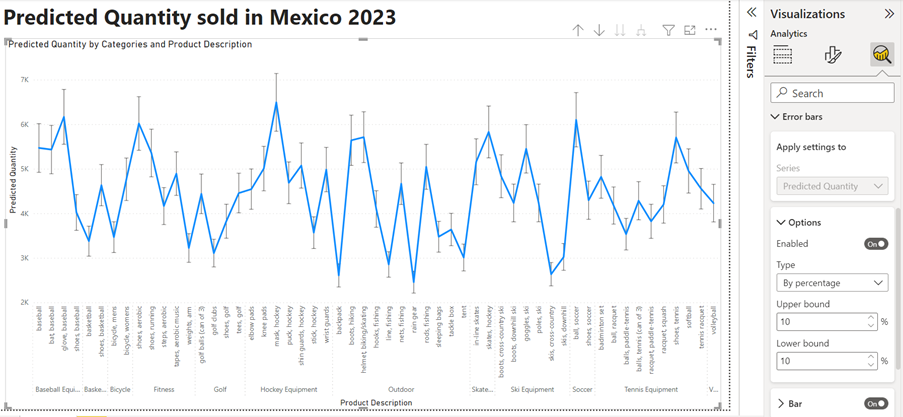
Under analytics you have many options, like adding a trend line, average line, percentile line etc. You also have the option to add error bars.

If you have calculated upper bound and lower bound for the error, you can add the measures to error bars, but in this case a percentage will be used to indicate a 90% confidence level.

By changing the type from By field to By percentage, the confidence level will now be displayed by bars.

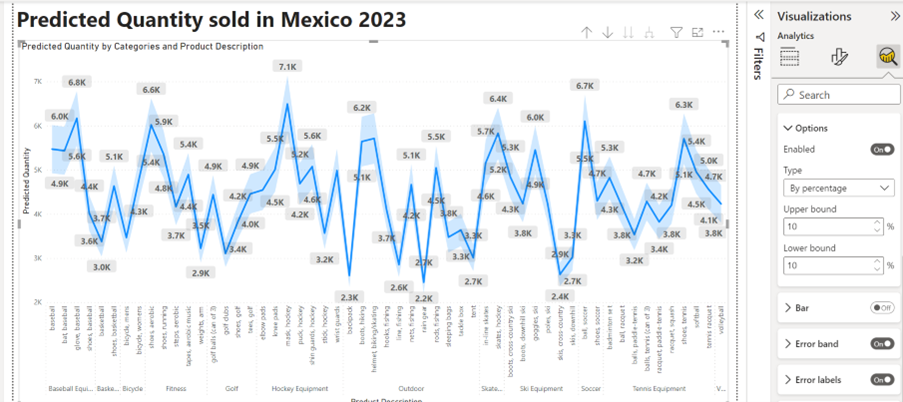
The error bars below have been turned off and error band turned on. Many people find this a lot clearer. The error labels have been turned on as well.

In the example above error labels are not the best solution to display. The values are not visible for all data points. Some data labels are not visible if there is not enough space.

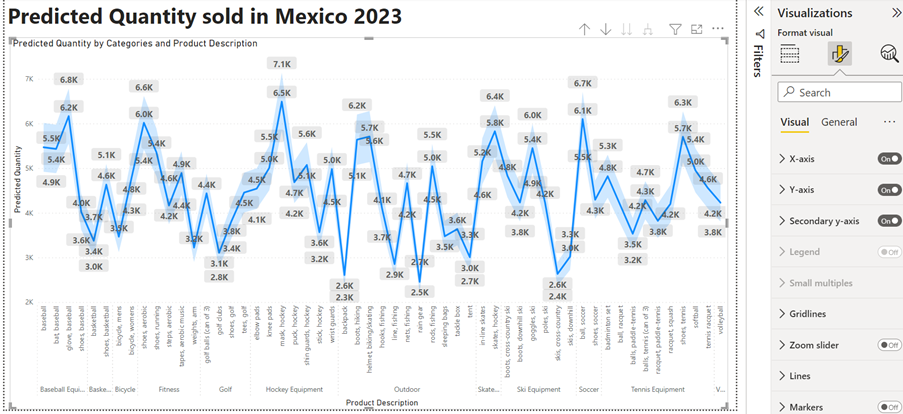
And if we add the data labels for the predicted measure.

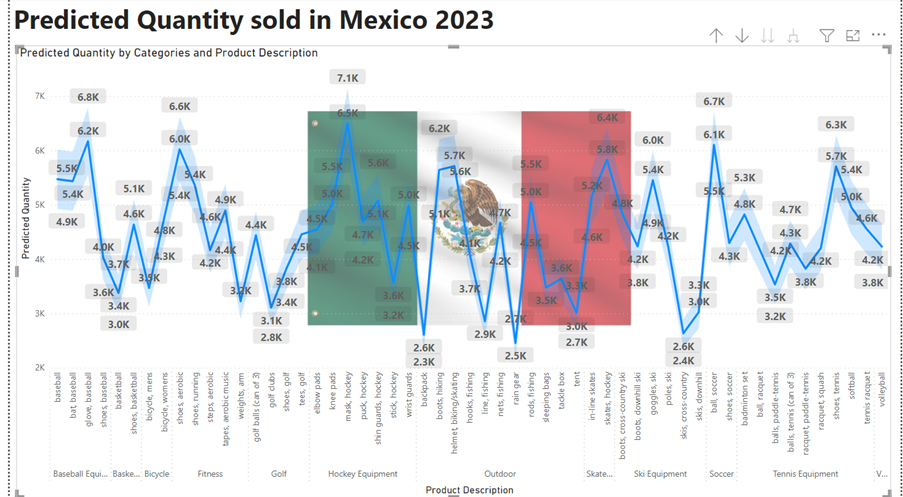
If you want the audience to get precise and easily understandable information, then this will not be the best solution. You can also add a plot background image to the visual. This may look exciting, but your audience may find it too busy, and you leave your visual open to misinterpretation. Have a look at the example below!

power

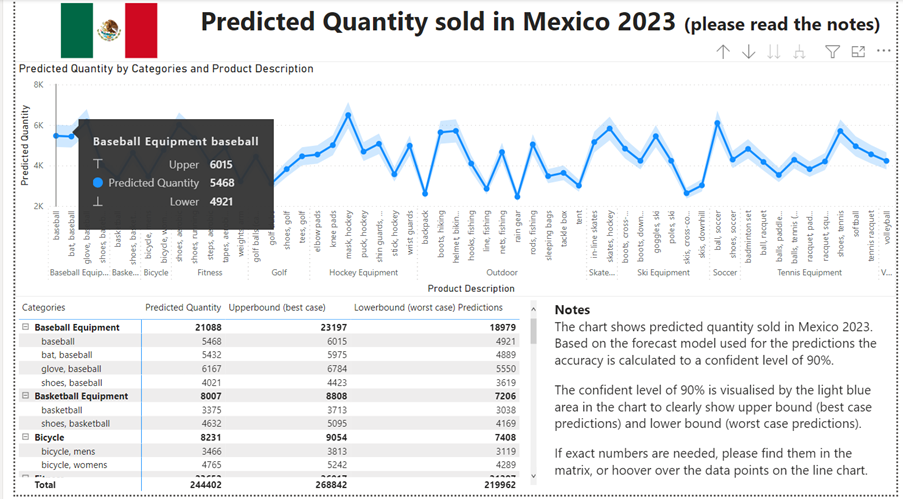
Arguably the best solution would be:

Some people prefer to digest information in text form.  Other people prefer images. In these examples, you can see it’s possible to satisfy both camps. Some would like to get the information from looking at the chart. Some from the exact numbers from the matrix. The notes added to the page will explain exactly what the page shows.

Conclusion

You must know your audience very well to understand their needs and create a successful report. One would like to have the information one way; another has other wishes. We need to make sure that the report is clear, however we present it!

We need to consider a lot of variables. A useful tip: Involve the audience from the beginning of the development of the report. This way you will receive feedback early enough so that you do not have to re-do hours or even days of work!

Categories
Application Hints & Tips Microsoft Power BI

Navigating to visuals: Bookmark Buttons in Power BI Desktop

Your Power BI report needs to be as user friendly as possible for an end user to make insightful business decisions efficiently. So, what better way to grab their attention with the most salient sections of your report than to use Bookmark Navigator buttons. These buttons usually appear on the opening page and work by directing the end user to another page that is automatically filtered to the specific metrics that they want to see. A clearly labelled button is much easier to use than the filter tools so is ideal for those who have limited knowledge of Power BI.

What is a Bookmark, and why are they useful


A bookmark in a Power BI report is simply a snapshot of a filtered view captured in the report’s memory. Just like a bookmark on a website, it reflects the current view and can be ‘revisited’ any time you like. A Power BI report may contain many pages with many visuals on each page. It can be somewhat overwhelming to navigate to the data of interest so bookmarks in the form of buttons can help with this analysis and help you be more productive

How to get started


There are 2 stages to creating Bookmark Buttons. First you need to create the bookmark on one page and then attach it to a button on another page. Up until November 2021, this was the only way to create these buttons. Since then the new Navigator Bookmark button feature has made the ‘button attachment stage’ a lot more automated.

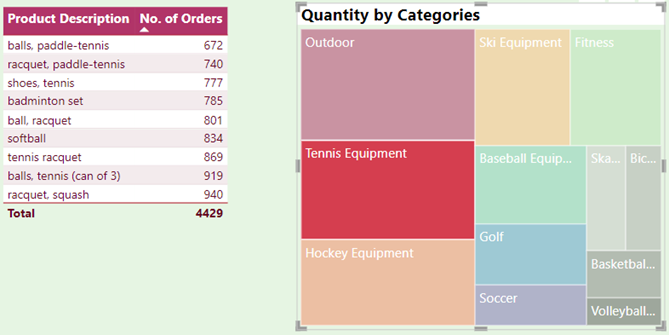
Let’s say you are reporting on the number of orders for each Product. You want to select a particular Product Category so that the report instantly directs you to a filtered list of all products’ orders for this category e.g. Tennis equipment (see below)


  1. In Power BI Desktop, create a ‘Welcome Page’ (for the Bookmark buttons)
  2. On a new page create a Table based on Products and the Number of Orders
  3. Next, create a Treemap visual based on ‘Quantity by Category’
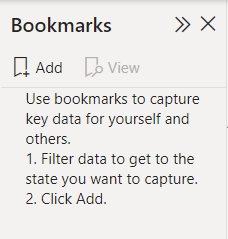
  4. Go to VIEW > BOOKMARKS to display a Bookmark pane:

  1. Now select ‘Tennis Equipment’ for example, from the Treemap to show all tennis related products
  2. Click the ‘Add’ button, go to the 3 dots, and choose RENAME from the list. Type ‘Tennis’ to label the bookmark
  3. Repeat steps 5 and 6 for two more categories
  4. Create a 4th Bookmark based on ‘All Categories’ i.e. one which shows no filtering
  5. Now click on each bookmark to check it reflects the correct filtered state
  6. On the ‘Welcome page’ go to INSERT > BUTTONS > NAVIGATOR > BOOKMARK NAVIGATOR

This action automatically displays a horizontal set of buttons:


  1. Holding down the ‘Control’ key, click on one of the buttons and you will be directed to the filtered view of the other page

Once your report is published, there is no need to use the Control key to activate the Bookmark buttons.

Conclusion

Using Bookmark Navigator buttons within your Power BI reports can significantly improve the end user experience. This will inevitably help them to be more efficient and profitable when making those all-important business decisions.


To learn more about Digital Storytelling, click on the link below:

https://www.stl-training.co.uk/sharing/principles-of-data-storytelling/83