Categories
Power Apps Technology

Clean data in Power Query to improve efficiency (part 1)

Have you ever pulled in data from various places to restructure it in Excel? Have you found yourself repeating this long, manual process every month when new data is added? The solution is to use Power Query. This blog is the first in a series of four. We will show you what Power Query can do to save you lots of time and help you become more productive. Let’s see how we can clean data in Power Query to improve efficiency (part 1).

What is Power Query and why is it useful?

Power Query is an app which transforms data sourced from many different locations before it is loaded into Excel. It works by making a connection back to the original data source. This means that whenever changes are made, they are saved as ‘Applied Steps’. These are stored in memory. The benefit is that a simple refresh in Excel is all that is needed to update any changes to the original data.

How to use Power Query
  1. In Excel, open a dataset with a column structure that needs some cleaning. In the example below, the ‘Full Name’ field has text entries where unwanted spaces need to be removed e.g. ‘ Anna Brown’

  1. Ideally the data needs to be a table before launching Power Query. To create a table, select a cell within the dataset and go to HOME > FORMAT AS TABLE. Select a coloured thumbnail and click OK in the ‘Create Table’ box
  2. Connect to the source data: DATA > FROM TABLE/RANGE. (NB. For any data that is external to Excel, go to DATA > GET DATA and browse to the specific data source)
  3. The following window appears:

  1. Note the ‘Applied Steps’ section on the right that will expand to include further steps
  2. Now select the ‘Full Name’ field, right click, and go to TRANSFORM > TRIM.

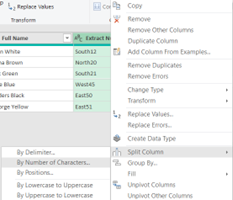
Right click on the ‘Extract Numbers’ field and go to SPLIT COLUMN > BY NUMBER OF CHARACTERS:

  1. Enter ‘2’ for ‘Number of Characters’ and select the radio button to split: ‘Once, as far right as possible’. Click OK
  2. Double click on each of the split columns and enter ‘Region’ and ID_no.

Now apply the changes back to Excel:

  1. In the Home tab, go to CLOSE & LOAD > CLOSE & LOAD TO > TABLE. Click OK to load the table to a new sheet
  2. Now in a new row under ‘Full Name’ add ‘ Mike Orange’ – with 2 leading spaces and under ‘Extract Numbers add ‘North19’
  3. Finally in the new sheet, go to QUERY > REFRESH and check the new data has changed

Power Query in Excel can connect to a vast range of external sources as well as within Excel itself. These include other Excel workbooks, financial systems, databases, websites, SharePoint, and many others.

Conclusion

Power Query is a powerful and extremely useful tool. It allows you to repeat routine cleaning tasks on your datasets without having to do it all manually. This tool will therefore help you become more efficient in the way you manage data which ultimately increases profitability. This concludes ‘Clean data in Power Query to improve efficiency (part 1)’.

For course details on our Power Query course at STL, please click on the link below:

https://www.stl-training.co.uk/syl/300/excel-power-query.html

Check out this useful article on data trends:

https://www.inc.com/john-hall/5-trends-in-data-emerging-in-2020.html


Categories
Data Visualisation Power BI

Let your Data tell the Story with Power BI

Tired of interrupting your PowerPoint presentation just so that you can show the live version of your report in Power BI? You can now create interactive PowerPoint presentations which connect live to your Power BI reports! This blog will show how you can let your data tell the story with Power BI.

Imagine that you are called on to present the new sales strategy for next year. In the presentation, you would like to present some statistics for the current year.

In the Power BI June 2022 version, there is a feature which can help you build engaging and dynamic PowerPoint presentations.

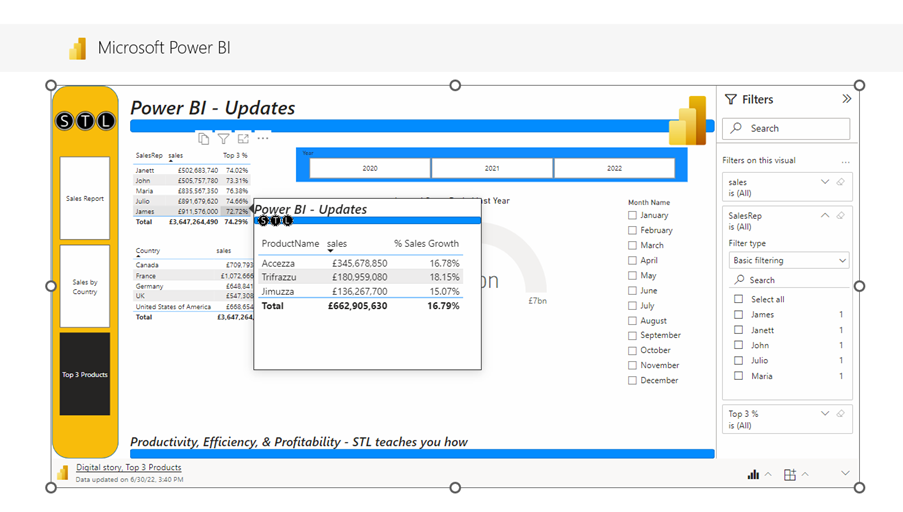
Say you want to show the audience statistics or other business intelligence information from your Power Bi reports during a meeting. No longer do you need to stop the PowerPoint presentation to open the Power BI report. You can simply integrate the Power BI report pages as slides in the presentation! The slide will display the live Power BI page. This means that all the interactivity from the Power BI page will work on the PowerPoint slide.

If your Power BI reports refresh live or when you manually refresh them, PowerPoint will also refresh during your meeting!

How does it work and how do you do it?

It is quite simple. You open your Power BI Service where you store your published reports. Here, you open the report containing the page you want to integrate in your PowerPoint presentation.

You can create a new PowerPoint presentation from your Power BI page, or you can add the Power BI page into an existing PowerPoint presentation.

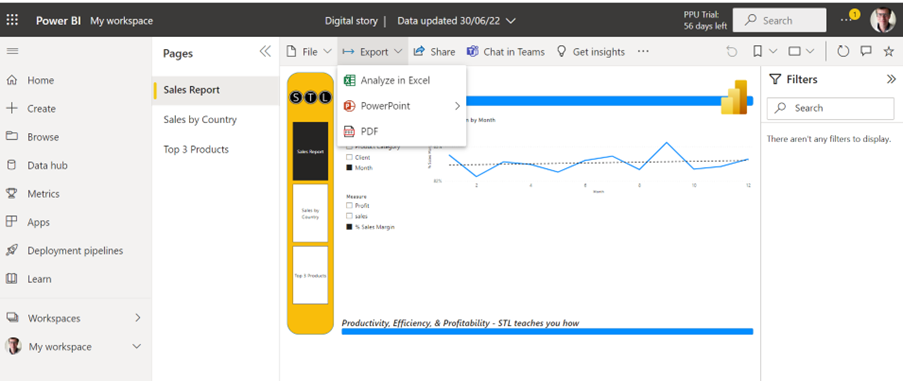
With the Power BI report open in Power BI Service, click Export, and click PowerPoint.

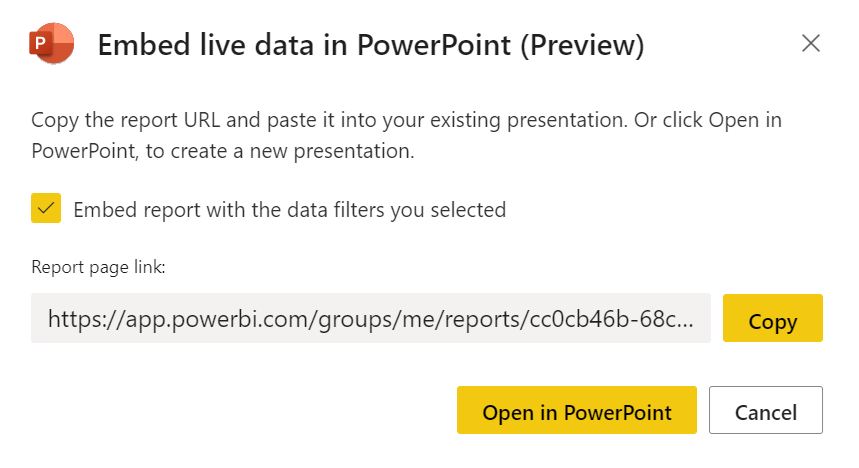
You now have two options.

  • You can copy the Report page link and paste it into a PowerPoint slide. If you do this and click on the link during a presentation, you will open your browser and open the report in Power BI service.
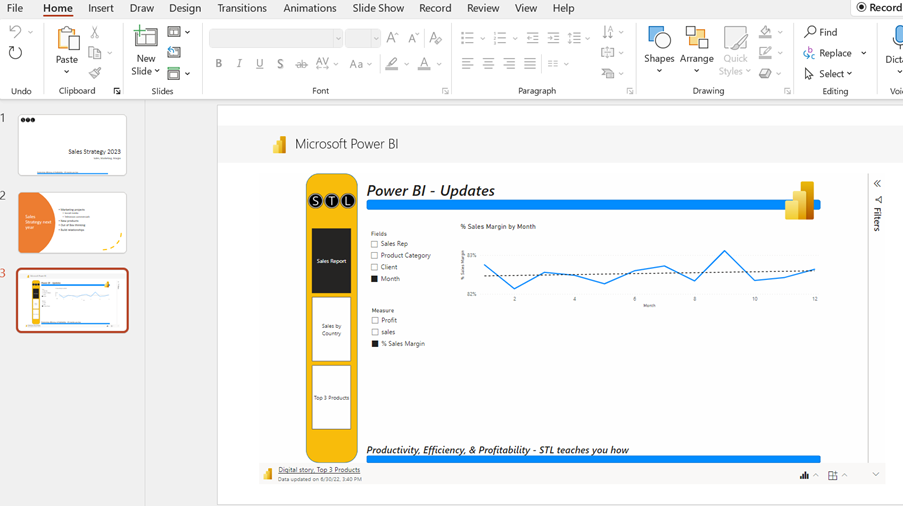
  • You can choose ‘Open in PowerPoint’. The PowerPoint application will open, and you will get a slide containing the live report page. Here you can use all the functionality from your Power BI report!

If you’ve added Page Navigation to the page, you can navigate through many Power BI report pages from one PowerPoint slide.

You can also sort and filter your report during the PowerPoint presentation. Moreover, if you have built custom tool tips, they will also pop up when you hover over the visuals in the report.

Your PowerPoint presentation will update if you change the report in Power BI desktop and publish the report to replace the old one. In other words, next time you need to use the PowerPoint presentation, all the changes you made will update in the PowerPoint presentation.

Conclusion

This is yet another good reason to choose Power BI for reporting and creating dashboards. You do not need to jump back and forth between the reports and the PowerPoint presentation. The presenter can access and show a lot of information from one single slide.

You do not need to update the PowerPoint presentation by creating new charts or slides to show current data or business intelligence.

This new Power BI tool can save time and make meeting preparations much more efficient. Let your Data tell the Story with Power BI.

STL runs four different Power BI courses and PowerPoint Introduction and PowerPoint Intermediate/Advanced courses.