Categories
Excel Training

Excel Charts – beginner’s guide to creating a pie chart

I’m new to the charting side of things…I’m used to staring at numbers on worksheets and trying to figure out what it all means…and admiring those around me who use charts…so mysterious…so professional looking…so much nicer than my rows of figures.

Charts make it so much easier to spot trends and analyse data – and I felt that the time had come to take a bite of that pie.  The idea of adding a chart filled me with a sense of dread…so I decided to  experiment with some basic charting to prove that it was possible to do, and all without the aid of several cups of coffee and a pep talk.

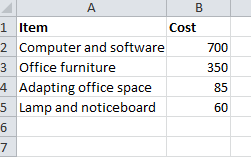
So here’s what I did.  As a simple example, I decided to look at how a pie chart could represent the cost of items in a range of categories for a (fictional) home office.
data-to-make-simple-chart-for-excel
Basic data for creating a small home office

I can show this data in a more visual way using a chart.  I can access charting options via the Insert ribbon. The first step is to decide on  the kind of chart I want, so I’m opting for a pie chart to make it easier to compare the proportional costs involved.

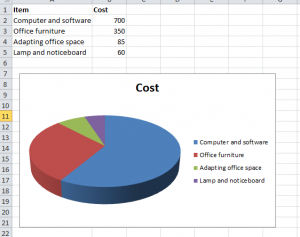
So, I select the data above and then go to the Insert ribbon, and click on the Pie Chart icon.   Because I’m feeling particularly brave, I’ve opted for the 3D pie chart…and it looks like this….
example-of-3d-piechart-cost-comparison-excel-training-intro-level
Here is my first attempt at using a 3D pie chart to show the costs involved in creating a home office.

It is a basic example, but it proved to me how easy it was to insert a chart – it took less than a minute to do.  Now…what can I chart next…


Categories
Excel Training

Excel Training: Let Excel do the number-crunching with Autosum

For those of us who can break out into a cold sweat at the mere mention of a “formula”, Excel has functions already set up to remove the need for towels and darkened rooms.

I use Excel’s common functions every day – autosum, averages, count and minimum and maximum – all I have to do is select the cells I want, and select the function.  This makes it incredibly quick and easy to get answers – without the need for me to write in formulas.

With only 83 days to go until Christmas (!) let’s imagine that a team has been asked to write their wish list for Santa.  As Santa’s office elf, I then collect the wishes and need to work out how much the wishes cost, and tell my boss how much the total is, what the average is, so that he can decide whether Santa should grant the wishes or take some poetic licence on what everyone gets….

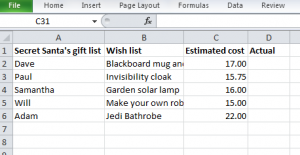
My excel sheet looks like this:

Excel training London example for Autosum
Excel sheet showing the basic information for the Secret Santa wishlist…Santa’s elf now needs to work out the costs to see if Santa can afford all the presents….

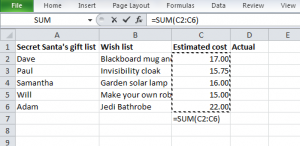
I now want to use autosum to find the total cost of wishes…so I select the cell immediately below the column of data (cell C7).  I then click on the formulas tab, and click autosum, in the Function Library group.

So the screen now looks like this:

Excel training on autosum for Santa's wishlist
Screenshot of autosum calculation

Now Santa knows that the total cost is £85.75.  But there has been a record number of people on the nice list, so Santa only has a £70 budget, so the elves have checked if they can source cheaper options for the same items…and they’ve added this to the worksheet, and used autosum again to find the total.

Screenshot of Santa's reduced cost wishlist with autosum and averages
Screenshot of Santa’s reduced cost wishlist with autosum and averages


But this time, I access autosum by highlighting the cells, and looking in the bottom right corner of my worksheet.  From this, I can see that the average cost per gift is £7.71 for 5 items, and the total cost is the Sum £38.53.

Excel-training-quick- view-of-autosums

So thrifty Santa knows that he can now give everyone their gift, under budget, as long as they stay on the nice list until Christmas Eve.