Categories
Application Power Apps Power BI

Exploit Power BI’s Drilling tools to enhance Profitability

In Power BI, you can apply Drilling tools to certain visuals in order to ‘drill down’ through your data. It works by building fields into your visuals that take you from ‘top level’ information (e.g., Sales by Country) right down to specific sales (e.g., Sales by Salesperson) known as ‘granular data’. Drilling down will change the visual to reflect more of the detail. This blog explains the different Drill buttons and their functionality to help you improve the way you analyse your data. You will be able to exploit Power BI’s Drilling tools to enhance profitability in your company.

Why use Drilling tools

Drilling tools really help an end user/stakeholder to fully understand the detail behind a specific visual in order to drive business forward and increase profitability

How it works

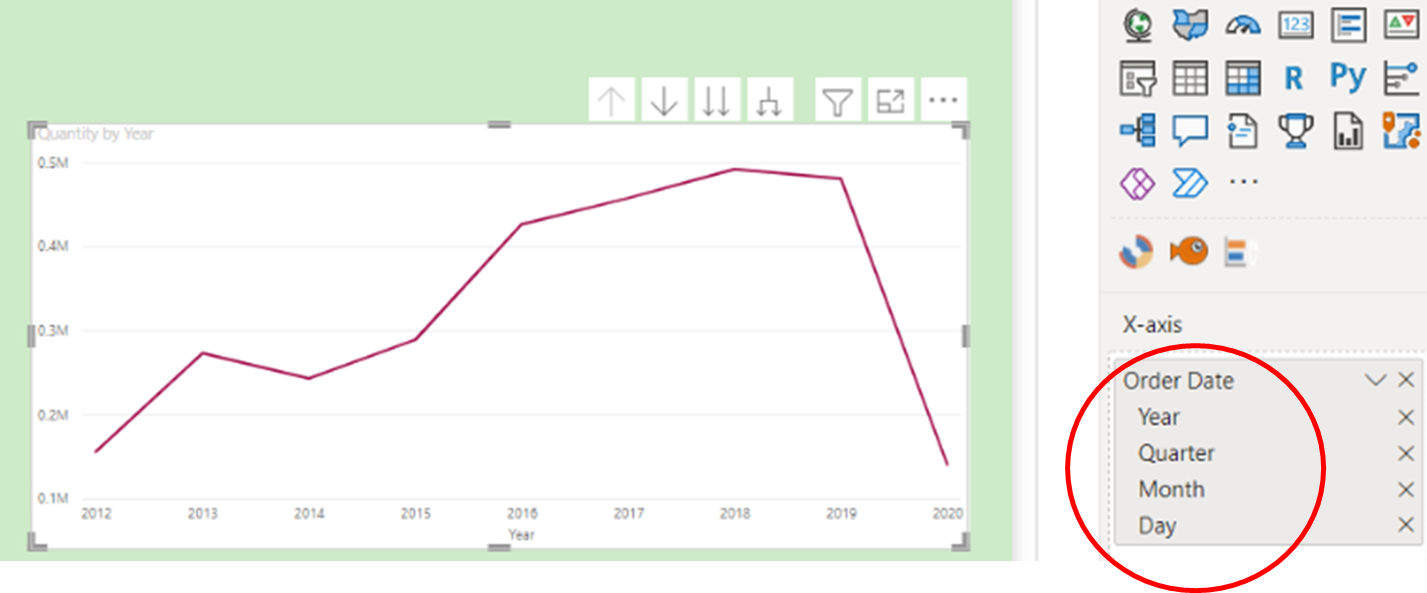
Firstly, you need to create a visual containing ‘hierarchical’ fields e.g., ‘Country’, ‘Segment’, ‘Salesperson’ in order to facilitate the drilling tools. In the following example, a line chart is used to show an ‘Order Date’ field by ‘Quantity’ where Power BI desktop will automatically support a Date Hierarchy (see below).

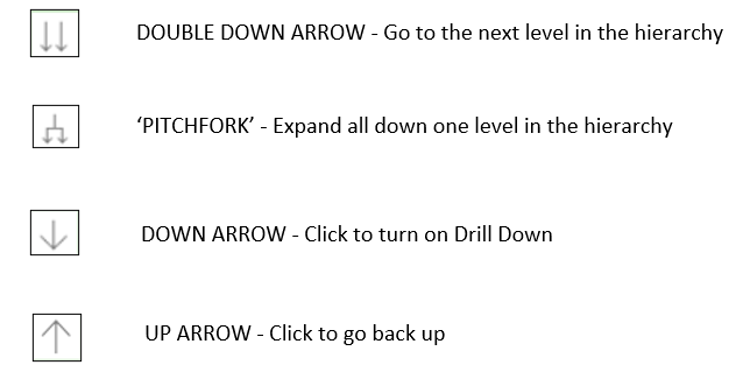
  1. Notice there are four ‘arrow’ buttons above the chart, each with a different function:
  1. Starting at the ‘top level’ i.e., ‘Quantity by Year’ click on 

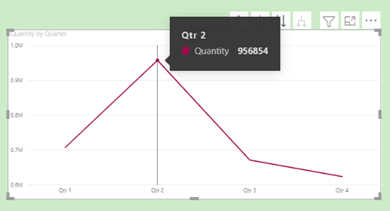
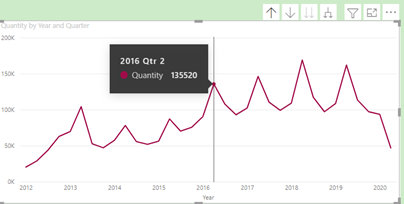
This action changes the line chart to show ‘Quantity by Quarter’ i.e., the next level down. for If you hover on the data point of Qtr. 2, it highlights the overall Quantity for Qtr. 2 over the entire 8-year period.

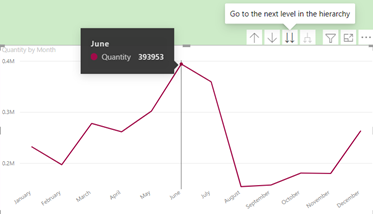
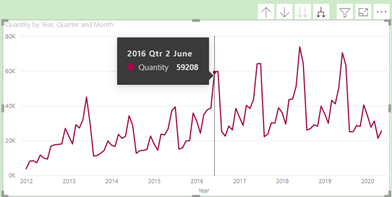
  1. Clicking on the    button again brings up another view – i.e., ‘Quantity by Month’:

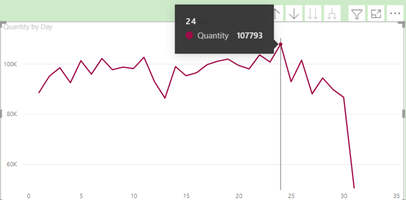
  1. Again, clicking on the      button again brings up a daily view – i.e., ‘Quantity by Day’:

Note the tooltip showing that the day in which most quantities are sold in any month is the 24th.

  1. The ‘double down’ arrow is now faded out, which means this level is the lowest level of granularity
  2. Click on the    button to go back through the hierarchical levels to the top level
  3. Now click on the ‘Pitchfork’ button   to show the next expanded level:

The tooltip is now showing all Quantities in Qtr. 2 of 2016.

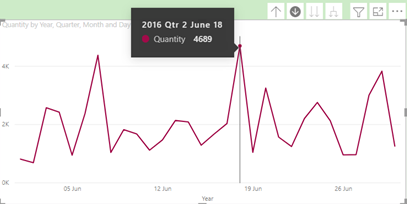
  1. Click on the    button again to show the chart at month level:

Now the tooltip is showing all Quantities in June Qtr. 2 of 2016. Let’s say you wanted to analyse the data further at day level in this particular month of June.

  1. Click on the ‘Drill Down’ arrow   to turn it on showing the following:

This now reveals that the highest performing day in terms of Quantity is the 18th.

Conclusion

So often in business, it is the details that can provide a competitive edge to improve performance. Having access to the various levels of data within a single visual using the Drill buttons will definitely help to achieve this goal. Exploit Power BI’s Drilling tools to enhance profitability in your company.

For course details on our Power BI Reporting course at STL, please click on the link below:

https://www.stl-training.co.uk/syl/355/power-bi-training-courses.html

For more information on Data analysis in business, please click below:

https://www.inc.com/carol-sankar/how-your-data-can-improve-your-customer-relationships.html

Categories
Application Hints & Tips Microsoft Power Apps Power BI

Power BI AI Visuals Part 4 – Smart Narrative

Microsoft has created some very interesting AI (Artificial Intelligence) visuals for Power BI. Power BI offers four AI visuals – Q&A, Key Influencers, Decomposition Tree, and Smart Narrative. This is Power BI AI Visuals Part 4 – Smart Narrative.

AI visuals are very useful. All four can provide your report with insight information from your data model. Without these, you need DAX measures to create your own visuals.

Power BI AI Visuals Part 4 – Smart Narrative

Smart Narrative

The Smart Narrative AI visual can explain your graphic by searching for key influencers in your data model.

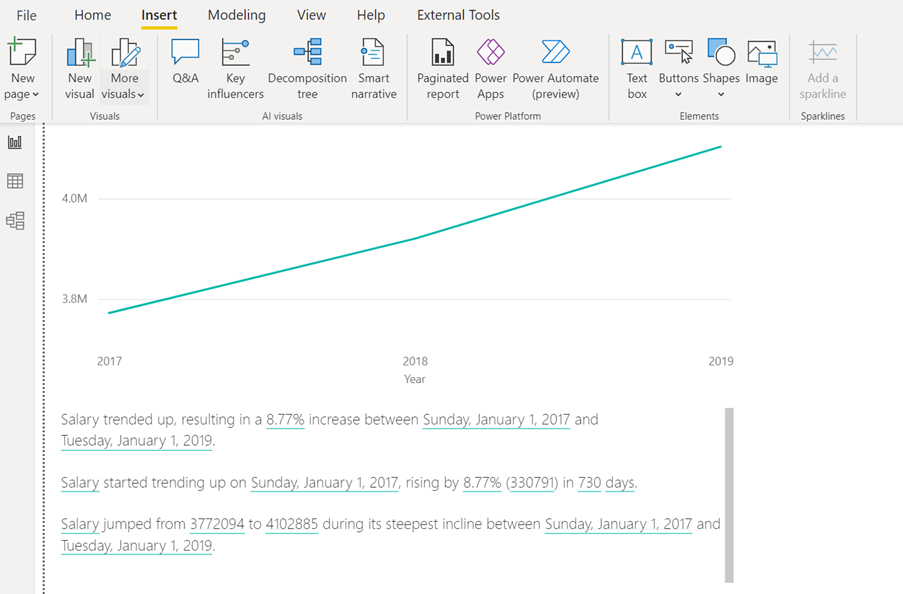
In the example below, you can see a simple line chart. The data model in this example is from HR data and the line chart show salaries for all employees over 3 years from 2017 to 2019. To get insights from the smart narrative visual, it needs to be selected. In this example, select the line chart, then click Smart Narrative on the Insert tab in the AI Visuals group. Power BI will then find interesting statistics and create a text box with these statistics. In the simple example below, below the line chart you can see the result of this analysis.

A More Interesting Example

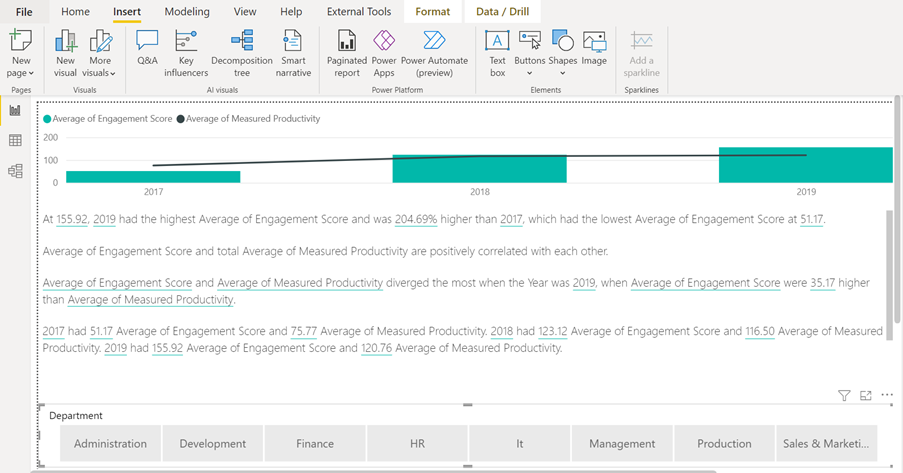
In the HR data model used here, we measured the employees’ productivity and engagement scores. In the example below, we need to explain the correlation between engagement and productivity on a Power BI page.

Below you can see the visual for all departments and the text box created by Smart Narrative.

Above, you can see a slicer to filter by department at the bottom of the page. The Smart Narrative text will change if you filter the chart visual.

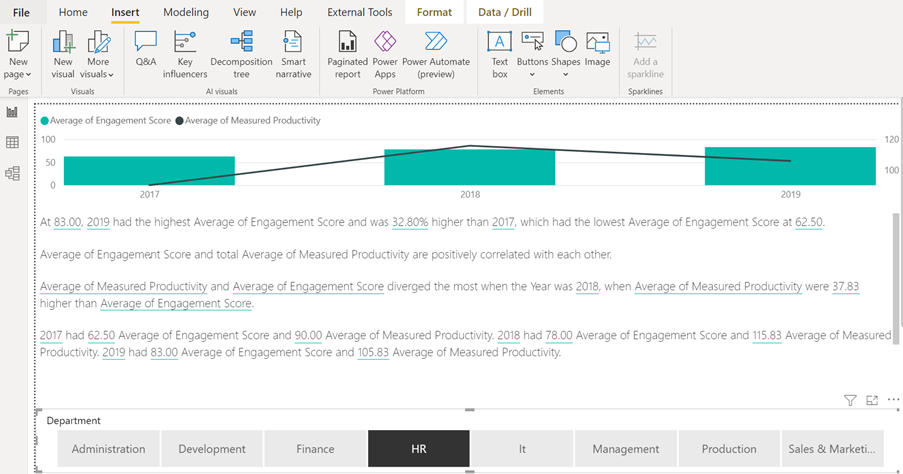
Below, the page is filtered to only show data from the HR department. In the example above, there was close positive correlation between engagement score and productivity. However, you will see in the example below that the trend is different in the HR department. The engagement is still positively correlated by the productivity over all 3 years, but the last year is negatively correlated. You can also see that the Smart Narrative tool now only looks at insight data about the HR department.

Conclusion

Before Smart Narrative was available in Power BI desktop, we had to create text boxes with static text to explain the visuals. Smart Narrative not only explains the visual but also gives the audience insight which takes the in-depth analysis to provide a number of DAX measures. Furthermore, it is dynamic. When the trends change over time, the text will update. As you saw in the examples above, the narrative will also change when the visuals get filtered.

This concludes Power BI AI Visuals Part 4 – Smart Narrative. If you would like to find out about the other AI visuals in Power BI, please follow STL on LinkedIn or visit our website.

STL has two Power BI courses which include AI visuals. Power BI Reporting and Power BI Modelling, Visualisation and Publishing.