Formerly Best Training
© 2024 . All Rights Reserved.
All prices offered for business users and exclude VAT. E&OE
2nd Floor, CA House, 1 Northey Street, Limehouse Basin, London, E14 8BT. United Kingdom
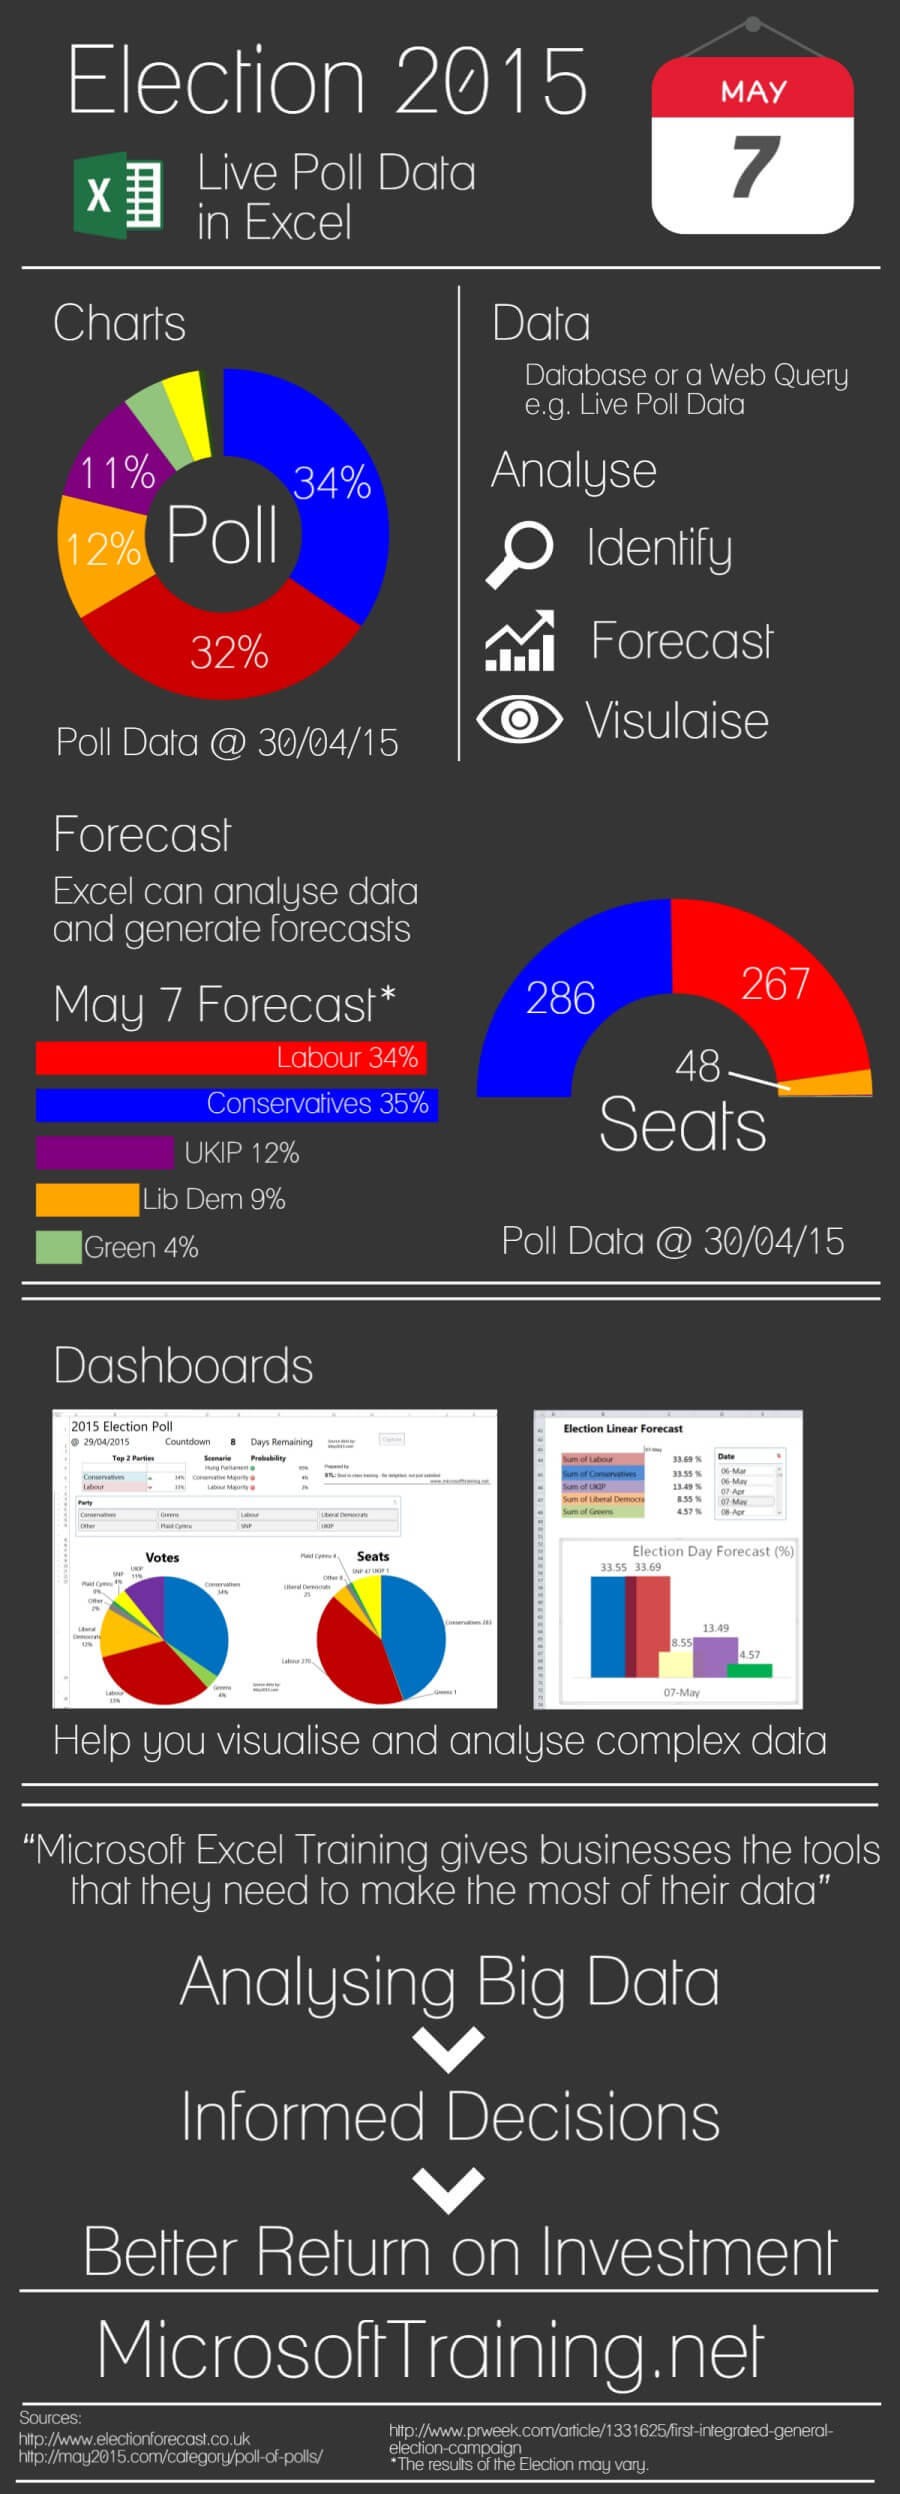
The general election is now in it's final stages and the race couldn't be closer. Wherever you look there are scores of sources all with a different interpretation of the polls!
But what if you want to analyse the data for yourself?
Step in Excel, it's got all the features you need to crunch the data and even display it with some presentable charts. Let's take a look at how we can examine poll data in Excel.
Learn how to use Excel for data analysis with one of our Excel forecasting and data analysis training courses.

If you would like to harness more of Excel's features you can choose from a variety of training options and course levels.
Best STL offer training courses at their London venues and at clients sites UK wide/ abroad. Other formats available include, eLearning, webinars, and bespoke/consultancy solutions. Click here for more information.
Copy and paste the HTML code to your page.
We'll call during UK business hours
Server loaded in 0.07 secs.